OPEN-SOURCE SCRIPT
Aggiornato VR1 DEMA - Liquidity Identifier
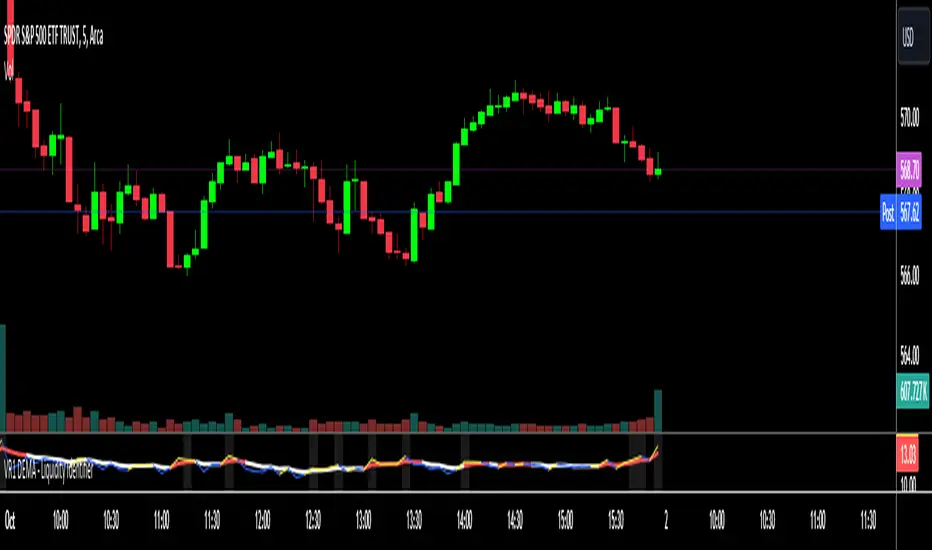
This custom Pine Script indicator, titled "VR1 DEMA - Liquidity Identifier", is designed to help traders identify periods of significant resistance to price movement, often indicating high liquidity areas where the market may encounter difficulty moving in one direction. The indicator analyzes the relationship between volume and price range, combined with bar volume conditions, to provide enhanced signals of potential liquidity buildup.
Key Features:
Customizable EMA Lengths:
Users can define the lengths of both the fast and slow Exponential Moving Averages (EMAs), with default values of 5 for the fast EMA and 13 for the slow EMA. These EMAs are calculated from the ratio of volume to price range, smoothing the data to detect trends in liquidity.
Dynamic Fast EMA Color:
The fast EMA changes color based on its relationship to the slow EMA:
Red when the fast EMA is above the slow EMA, signaling stronger resistance or greater liquidity.
White when the fast EMA is below the slow EMA, indicating potentially weaker resistance.
Liquidity Signal with Multiplier Condition:
The background of the chart changes to white when the volume-to-price ratio exceeds 1.5 times the fast EMA. This highlights potential areas of liquidity buildup where price movement may encounter stronger resistance. The 1.5 multiplier is adjustable, allowing for sensitivity customization.
Volume Condition for Enhanced Signals:
A new condition is added that requires the actual bar volume to exceed 1.2 times the 5-period EMA of average bar volume. This ensures that the background color only changes when there is not only increased liquidity but also significantly higher trading volume. The 1.2 multiplier is user-adjustable for further refinement.
Combined Liquidity and Volume Filtering:
Both conditions (volume-to-price ratio and actual volume) must be met for the background color to change. This double-filtering helps traders spot moments of unusual market activity more accurately.
Optional Volume/Price Range Visualization:
An optional plot of the volume-to-price ratio is included, providing a visual representation of how volume interacts with price movement in real-time. This can be enabled or disabled based on user preference.
User-Friendly Customization:
The script includes inputs for adjusting the fast and slow EMA lengths, as well as the multipliers for the volume-to-price ratio and actual volume conditions. These customizable parameters allow traders to tailor the indicator to their specific market strategies.
Use Case:
This indicator is particularly useful for identifying periods of high liquidity and resistance in the market, where price movement may stall or reverse. By combining volume-to-price ratio analysis with actual volume conditions, the indicator provides more reliable signals for detecting potential breakouts, reversals, or consolidation periods. The color-coded fast EMA and background shading make it easy to spot key moments of increased market activity and liquidity.
Note di rilascio
This custom Pine Script indicator, titled "VR1 DEMA with Liquidity and Volume Conditions", is designed to help traders identify periods of significant resistance to price movement, often indicating high liquidity areas where the market may encounter difficulty moving in one direction. The indicator analyzes the relationship between volume and price range, combined with bar volume conditions, to provide enhanced signals of potential liquidity buildup.Key Features:
Customizable EMA Lengths:
Users can define the lengths of both the fast and slow Exponential Moving Averages (EMAs), with default values of 5 for the fast EMA and 13 for the slow EMA. These EMAs are calculated from the ratio of volume to price range, smoothing the data to detect trends in liquidity.
Dynamic Fast EMA Color:
The fast EMA changes color based on its relationship to the slow EMA:
Red when the fast EMA is above the slow EMA, signaling stronger resistance or greater liquidity.
White when the fast EMA is below the slow EMA, indicating potentially weaker resistance.
Liquidity Signal with Multiplier Condition:
The background of the chart changes to white when the volume-to-price ratio exceeds 1.5 times the fast EMA. This highlights potential areas of liquidity buildup where price movement may encounter stronger resistance. The 1.5 multiplier is adjustable, allowing for sensitivity customization.
Volume Condition for Enhanced Signals:
A new condition is added that requires the actual bar volume to exceed 1.2 times the 5-period EMA of average bar volume. This ensures that the background color only changes when there is not only increased liquidity but also significantly higher trading volume. The 1.2 multiplier is user-adjustable for further refinement.
Combined Liquidity and Volume Filtering:
Both conditions (volume-to-price ratio and actual volume) must be met for the background color to change. This double-filtering helps traders spot moments of unusual market activity more accurately.
Optional Volume/Price Range Visualization:
An optional plot of the volume-to-price ratio is included, providing a visual representation of how volume interacts with price movement in real-time. This can be enabled or disabled based on user preference.
User-Friendly Customization:
The script includes inputs for adjusting the fast and slow EMA lengths, as well as the multipliers for the volume-to-price ratio and actual volume conditions. These customizable parameters allow traders to tailor the indicator to their specific market strategies.
Use Case:
This indicator is particularly useful for identifying periods of high liquidity and resistance in the market, where price movement may stall or reverse. By combining volume-to-price ratio analysis with actual volume conditions, the indicator provides more reliable signals for detecting potential breakouts, reversals, or consolidation periods. The color-coded fast EMA and background shading make it easy to spot key moments of increased market activity and liquidity.
Note di rilascio
This custom Pine Script indicator, titled "VR1 DEMA - Liquidity Identifier", is designed to help traders identify periods of significant resistance to price movement, often indicating high liquidity areas where the market may encounter difficulty moving in one direction. The indicator analyzes the relationship between volume and price range, combined with bar volume conditions, to provide enhanced signals of potential liquidity buildup.Key Features:
Customizable EMA Lengths:
Users can define the lengths of both the fast and slow Exponential Moving Averages (EMAs), with default values of 5 for the fast EMA and 13 for the slow EMA. These EMAs are calculated from the ratio of volume to price range, smoothing the data to detect trends in liquidity.
Dynamic Fast EMA Color:
The fast EMA changes color based on its relationship to the slow EMA:
Red when the fast EMA is above the slow EMA, signaling stronger resistance or greater liquidity.
White when the fast EMA is below the slow EMA, indicating potentially weaker resistance.
Liquidity Signal with Multiplier Condition:
The background of the chart changes to white when the volume-to-price ratio exceeds 1.2 times the fast EMA. This highlights potential areas of liquidity buildup where price movement may encounter stronger resistance. The 1.5 multiplier is adjustable, allowing for sensitivity customization.
Volume Condition for Enhanced Signals:
A new condition is added that requires the actual bar volume to exceed 1.2 times the 5-period EMA of average bar volume. This ensures that the background color only changes when there is not only increased liquidity but also significantly higher trading volume. The 1.2 multiplier is user-adjustable for further refinement.
Combined Liquidity and Volume Filtering:
Both conditions (volume-to-price ratio and actual volume) must be met for the background color to change. This double-filtering helps traders spot moments of unusual market activity more accurately.
Optional Volume/Price Range Visualization:
An optional plot of the volume-to-price ratio is included, providing a visual representation of how volume interacts with price movement in real-time. This can be enabled or disabled based on user preference.
User-Friendly Customization:
The script includes inputs for adjusting the fast and slow EMA lengths, as well as the multipliers for the volume-to-price ratio and actual volume conditions. These customizable parameters allow traders to tailor the indicator to their specific market strategies.
Use Case:
This indicator is particularly useful for identifying periods of high liquidity and resistance in the market, where price movement may stall or reverse. By combining volume-to-price ratio analysis with actual volume conditions, the indicator provides more reliable signals for detecting potential breakouts, reversals, or consolidation periods. The color-coded fast EMA and background shading make it easy to spot key moments of increased market activity and liquidity.
30 minutes ago
Release Notes
This custom Pine Script indicator, titled "VR1 DEMA with Liquidity and Volume Conditions", is designed to help traders identify periods of significant resistance to price movement, often indicating high liquidity areas where the market may encounter difficulty moving in one direction. The indicator analyzes the relationship between volume and price range, combined with bar volume conditions, to provide enhanced signals of potential liquidity buildup.
Key Features:
Customizable EMA Lengths:
Users can define the lengths of both the fast and slow Exponential Moving Averages (EMAs), with default values of 5 for the fast EMA and 13 for the slow EMA. These EMAs are calculated from the ratio of volume to price range, smoothing the data to detect trends in liquidity.
Dynamic Fast EMA Color:
The fast EMA changes color based on its relationship to the slow EMA:
Red when the fast EMA is above the slow EMA, signaling stronger resistance or greater liquidity.
White when the fast EMA is below the slow EMA, indicating potentially weaker resistance.
Liquidity Signal with Multiplier Condition:
The background of the chart changes to white when the volume-to-price ratio exceeds 1.2 times the fast EMA. This highlights potential areas of liquidity buildup where price movement may encounter stronger resistance. The 1.2 multiplier is adjustable, allowing for sensitivity customization.
Volume Condition for Enhanced Signals:
A new condition is added that requires the actual bar volume to exceed 1.2 times the 5-period EMA of average bar volume. This ensures that the background color only changes when there is not only increased liquidity but also significantly higher trading volume. The 1.2 multiplier is user-adjustable for further refinement.
Combined Liquidity and Volume Filtering:
Both conditions (volume-to-price ratio and actual volume) must be met for the background color to change. This double-filtering helps traders spot moments of unusual market activity more accurately.
Optional Volume/Price Range Visualization:
An optional plot of the volume-to-price ratio is included, providing a visual representation of how volume interacts with price movement in real-time. This can be enabled or disabled based on user preference.
User-Friendly Customization:
The script includes inputs for adjusting the fast and slow EMA lengths, as well as the multipliers for the volume-to-price ratio and actual volume conditions. These customizable parameters allow traders to tailor the indicator to their specific market strategies.
Use Case:
This indicator is particularly useful for identifying periods of high liquidity and resistance in the market, where price movement may stall or reverse. By combining volume-to-price ratio analysis with actual volume conditions, the indicator provides more reliable signals for detecting potential breakouts, reversals, or consolidation periods. The color-coded fast EMA and background shading make it easy to spot key moments of increased market activity and liquidity.
Note di rilascio
VR1 DEMA - Liquidity IdentifierThe VR1 DEMA - Liquidity Identifier is a powerful TradingView indicator designed to help traders visualize and identify areas of high liquidity in the market. The core concept is based on the premise that periods of heavy volume with minimal price movement signify zones of increased liquidity. Recognizing these zones can be crucial for traders aiming to anticipate significant market moves or validate support and resistance levels.
________________________________________
Key Features
1. Volume/Price Range Ratio Calculation:
o Computes the ratio of trading volume to the price range (high minus low) for each bar.
o Highlights periods where substantial trading activity occurs without significant price changes, indicating potential liquidity pools.
2. Dynamic Exponential Moving Averages (EMAs):
o Calculates both Fast and Slow EMAs of the Volume/Price Range Ratio.
o The Fast EMA reacts quickly to recent changes, while the Slow EMA smooths out longer-term trends.
o Color Coding:
Fast EMA Line:
Red when the Fast EMA is above the Slow EMA, suggesting increasing liquidity.
White when the Fast EMA is below the Slow EMA, indicating decreasing liquidity.
Volume/Price Range Ratio Line:
Yellow when it exceeds the Fast EMA, highlighting potential high liquidity.
Blue when it's below the Fast EMA.
3. Background Highlighting for Liquidity Zones:
o The background color changes (translucent white) when:
The Volume/Price Range Ratio exceeds a user-defined multiple of the Fast EMA.
The actual volume is greater than a user-defined multiple of the EMA of average volume.
o This visual cue emphasizes periods where both volume and liquidity metrics align, pinpointing significant liquidity areas.
4. Customizable Parameters:
o EMA Lengths:
Adjust the lengths of the Fast and Slow EMAs to suit different timeframes and trading strategies.
o Multipliers:
Set the sensitivity for when the Volume/Price Range Ratio and volume trigger visual alerts.
o Visibility Controls:
Option to show or hide the Volume/Price Range Ratio plot for a cleaner chart view.
________________________________________
How to Use the Indicator
• Identify High Liquidity Zones:
o Look for areas where the Volume/Price Range Ratio line turns yellow and the background is highlighted.
o These zones indicate high trading volume with limited price movement, suggesting strong liquidity.
• Analyze Market Momentum:
o Monitor the color of the Fast EMA line:
Red Line: Fast EMA above Slow EMA, potential uptick in liquidity.
White Line: Fast EMA below Slow EMA, potential decrease in liquidity.
• Customize to Your Strategy:
o Modify the EMA lengths and multipliers to fine-tune the indicator according to your specific trading approach and the asset being analyzed.
________________________________________
Benefits of the VR1 DEMA - Liquidity Identifier
• Enhanced Market Insight:
o Gain a deeper understanding of market dynamics by identifying where significant trading activity is concentrated without substantial price shifts.
• Improved Decision Making:
o Use liquidity zones to anticipate potential breakout or reversal points.
o Combine with other technical analysis tools for more comprehensive market analysis.
• Visual Clarity:
o Dynamic color changes and background highlights make it easy to interpret complex data quickly.
________________________________________
Important Notes
• Complementary Tool:
o This indicator should be used alongside other analysis methods. It provides insights into liquidity but does not guarantee market movements.
• Market Conditions Vary:
o Always consider the broader market context. High liquidity zones may have different implications in trending markets versus ranging markets.
• User Responsibility:
o Adjust parameters thoughtfully. Over-sensitivity may lead to false signals, while under-sensitivity might miss critical information.
________________________________________
Elevate your trading by integrating liquidity analysis into your strategy with the VR1 DEMA - Liquidity Identifier. Understanding where liquidity resides can be the key to unlocking more informed and potentially profitable trading decisions.
________________________________________
Happy Trading!
Note di rilascio
This release is intended to solve scaling issues by utilizing a log transform.By applying the logarithmic transformation, the indicator should now display more consistently throughout the trading day without being distorted by extreme volume spikes.
Script open-source
Nello spirito di TradingView, l'autore di questo script lo ha reso open source, in modo che i trader possano esaminarne e verificarne la funzionalità. Complimenti all'autore! Sebbene sia possibile utilizzarlo gratuitamente, ricordiamo che la ripubblicazione del codice è soggetta al nostro Regolamento.
Declinazione di responsabilità
Le informazioni e le pubblicazioni non sono intese come, e non costituiscono, consulenza o raccomandazioni finanziarie, di investimento, di trading o di altro tipo fornite o approvate da TradingView. Per ulteriori informazioni, consultare i Termini di utilizzo.