PROTECTED SOURCE SCRIPT
Aggiornato BankNifty-15min Intraday-High Risk-R-AlgoAI-Final Copy
// This script is for educational and informational purposes only.
// It does not constitute financial or investment advice.
// Trading involves substantial risk and may not be suitable for all investors.
// Always do your own research or consult with a licensed financial advisor
// before making any trading or investment decisions.
// The author is not responsible for any losses incurred using this script.
⚡ Overview:
This script is a technical indicator designed for intraday trading on the Bank Nifty future chart using the 15-minute timeframe. It uses a combination of normalized buy and sell pressure along with a Hull Moving Average (HMA) smoothing method and volume-based normalization to detect potential buy and sell signals.
💡 Main Concept:
Buy and Sell Pressure Calculation:
The script calculates:
bp (Buy Pressure): close - low
sp (Sell Pressure): high - close
These values are smoothed using a custom Hull Moving Average (HMA) function, designed to reduce lag and react quicker to price changes compared to traditional moving averages.
📊 Normalized Signals:
Buy and Sell pressures are normalized against their HMA smoothed values.
Volume normalization is also applied to adjust for the effect of market activity on the pressure signals.
📌 Signal Logic:
A Buy Signal is generated when:
Only one signal per day is allowed to avoid signal spamming.
A Sell Signal is generated under the opposite conditions:
One sell signal per day.
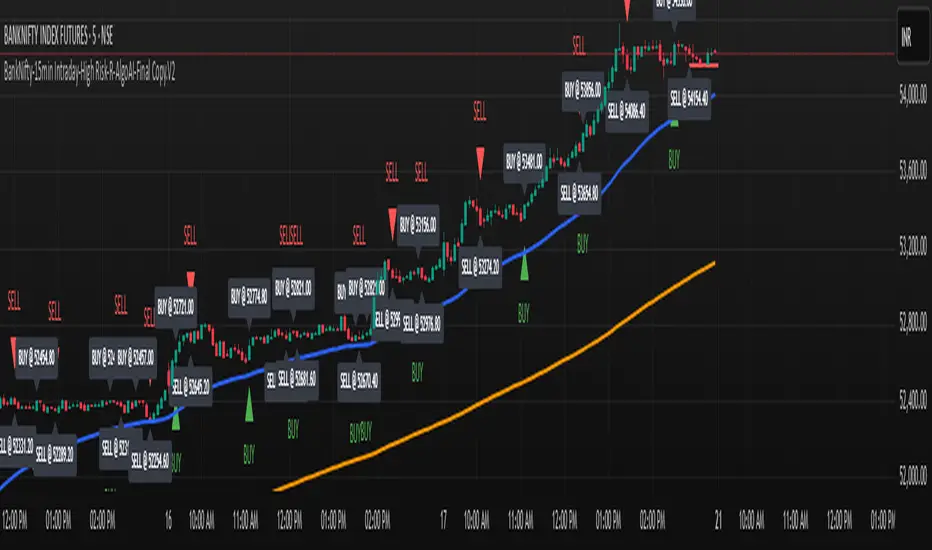
🧾 Visual Output:
When a signal is triggered, the script:
Draws a horizontal line at the signal price (with labels like BUY @ or SELL @).
Plots triangle markers on the chart to highlight buy (green) or sell (red) signals.
Deletes or extends lines at the end of each day to maintain visual clarity.
📈 Additional Features:
EMA 50 & EMA 200:
Plots two common Exponential Moving Averages (50-period and 200-period) for trend visualization.
⚠️ Important Notes:
This script is meant for educational and research purposes only.
It is designed for high-risk intraday trading.
Signals are based on historical behavior and should not be treated as financial advice.
No stop-loss or take-profit logic is included — traders should manage risk independently.
✅ Summary:
This indicator offers a simple visual and quantitative approach to spot potential intraday turning points for Bank Nifty future on a 15-minute chart, with clear buy and sell markers. It combines volume, price pressure, and moving average smoothing to filter out random price movements.
// It does not constitute financial or investment advice.
// Trading involves substantial risk and may not be suitable for all investors.
// Always do your own research or consult with a licensed financial advisor
// before making any trading or investment decisions.
// The author is not responsible for any losses incurred using this script.
⚡ Overview:
This script is a technical indicator designed for intraday trading on the Bank Nifty future chart using the 15-minute timeframe. It uses a combination of normalized buy and sell pressure along with a Hull Moving Average (HMA) smoothing method and volume-based normalization to detect potential buy and sell signals.
💡 Main Concept:
Buy and Sell Pressure Calculation:
The script calculates:
bp (Buy Pressure): close - low
sp (Sell Pressure): high - close
These values are smoothed using a custom Hull Moving Average (HMA) function, designed to reduce lag and react quicker to price changes compared to traditional moving averages.
📊 Normalized Signals:
Buy and Sell pressures are normalized against their HMA smoothed values.
Volume normalization is also applied to adjust for the effect of market activity on the pressure signals.
📌 Signal Logic:
A Buy Signal is generated when:
Only one signal per day is allowed to avoid signal spamming.
A Sell Signal is generated under the opposite conditions:
One sell signal per day.
🧾 Visual Output:
When a signal is triggered, the script:
Draws a horizontal line at the signal price (with labels like BUY @ or SELL @).
Plots triangle markers on the chart to highlight buy (green) or sell (red) signals.
Deletes or extends lines at the end of each day to maintain visual clarity.
📈 Additional Features:
EMA 50 & EMA 200:
Plots two common Exponential Moving Averages (50-period and 200-period) for trend visualization.
⚠️ Important Notes:
This script is meant for educational and research purposes only.
It is designed for high-risk intraday trading.
Signals are based on historical behavior and should not be treated as financial advice.
No stop-loss or take-profit logic is included — traders should manage risk independently.
✅ Summary:
This indicator offers a simple visual and quantitative approach to spot potential intraday turning points for Bank Nifty future on a 15-minute chart, with clear buy and sell markers. It combines volume, price pressure, and moving average smoothing to filter out random price movements.
Note di rilascio
⚡ Overview:This script is a technical indicator designed for intraday trading on the Bank Nifty future chart using the 15-minute timeframe. It uses a combination of normalized buy and sell pressure along with a Hull Moving Average (HMA) smoothing method and volume-based normalization to detect potential buy and sell signals.
💡 Main Concept:
Buy and Sell Pressure Calculation:
The script calculates:
bp (Buy Pressure): close - low
sp (Sell Pressure): high - close
These values are smoothed using a custom Hull Moving Average (HMA) function, designed to reduce lag and react quicker to price changes compared to traditional moving averages.
📊 Normalized Signals:
Buy and Sell pressures are normalized against their HMA smoothed values.
Volume normalization is also applied to adjust for the effect of market activity on the pressure signals.
📌 Signal Logic:
A Buy Signal is generated when:
Only one signal per day is allowed to avoid signal spamming.
A Sell Signal is generated under the opposite conditions:
One sell signal per day.
🧾 Visual Output:
When a signal is triggered, the script:
Draws a horizontal line at the signal price (with labels like BUY @ or SELL @).
Plots triangle markers on the chart to highlight buy (green) or sell (red) signals.
Deletes or extends lines at the end of each day to maintain visual clarity.
📈 Additional Features:
EMA 50 & EMA 200:
Plots two common Exponential Moving Averages (50-period and 200-period) for trend visualization.
⚠️ Important Notes:
This script is meant for educational and research purposes only.
It is designed for high-risk intraday trading.
Signals are based on historical behavior and should not be treated as financial advice.
No stop-loss or take-profit logic is included — traders should manage risk independently.
✅ Summary:
This indicator offers a simple visual and quantitative approach to spot potential intraday turning points for Bank Nifty future on a 15-minute chart, with clear buy and sell markers. It combines volume, price pressure, and moving average smoothing to filter out random price movements.
Disclaimer:
// This script is for educational and informational purposes only.
// It does not constitute financial or investment advice.
// Trading involves substantial risk and may not be suitable for all investors.
// Always do your own research or consult with a licensed financial advisor
// before making any trading or investment decisions.
// The author is not responsible for any losses incurred using this script
Script protetto
Questo script è pubblicato come codice protetto. Tuttavia, è possibile utilizzarle liberamente e senza alcuna limitazione – ulteriori informazioni qui.
Declinazione di responsabilità
Le informazioni e le pubblicazioni non sono intese come, e non costituiscono, consulenza o raccomandazioni finanziarie, di investimento, di trading o di altro tipo fornite o approvate da TradingView. Per ulteriori informazioni, consultare i Termini di utilizzo.