PROTECTED SOURCE SCRIPT
Euclidean VWATR
Overview
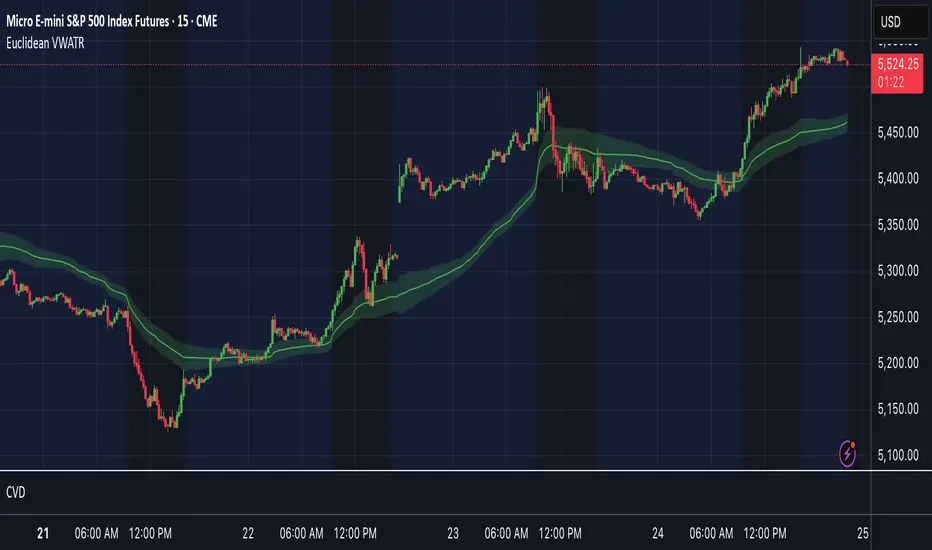
Dual-Centroid ATR Cluster Bands is an on-chart indicator that dynamically clusters price around two evolving centroids and builds volatility-based bands around each. By combining an online Euclidean update with average true range (ATR) and volume weighting, it creates two adaptive support/resistance zones and highlights which cluster price belongs to on each bar.
Key Features
- Two adaptive centroids that move toward price based on proximity and volume
- ATR-based upper and lower bands around each centroid to show volatility zones
- Volume weighting so high-volume bars shift centroids faster
- Background shading to show whether the current bar belongs to the red or green cluster
- Optional breakout flags for when price crosses each band (not tied to automated entries or exits)
Inputs
Learning Rate: speed at which centroids adapt to new price (0–1). Default = 0.025
Init Centroid 1 / Init Centroid 2: starting value for each centroid (0 uses the first bar’s close). Default = 0.0
ATR Length: lookback period for ATR calculation. Default = 14
ATR Band Multiplier: multiple of ATR used for upper and lower bands. Default = 1.5
Volume SMA Length: lookback period for smoothing volume to compute relative weight. Default = 20
Interpretation & Usage
- Trend vs. mean-reversion: price oscillating inside a colored zone suggests mean-reversion to that centroid.
- Equilibrium shifts: a move toward the midpoint between centroids may signal a cluster change.
- Breakout signals: use price crosses of the ATR bands as potential momentum entries (combine with volume or other filters).
- Dynamic support/resistance: treat the centroids and their bands as floating levels that adapt to market conditions.
- Volume sensitivity: high-volume moves will pull the centroids more strongly, making zones more responsive during heavy trading.
Recommended Tips
- Increase Learning Rate for faster adaptation in volatile markets.
- Raise ATR Band Multiplier in choppy conditions to reduce false breakouts.
- Adjust Volume SMA Length to emphasize recent or longer-term volume trends.
- Combine with other indicators (pivot points, VWAP, trend filters) for filtered entries.
Script protetto
Questo script è pubblicato come codice protetto. Tuttavia, è possibile utilizzarle liberamente e senza alcuna limitazione – ulteriori informazioni qui.
Declinazione di responsabilità
Le informazioni e le pubblicazioni non sono intese come, e non costituiscono, consulenza o raccomandazioni finanziarie, di investimento, di trading o di altro tipo fornite o approvate da TradingView. Per ulteriori informazioni, consultare i Termini di utilizzo.