OPEN-SOURCE SCRIPT
Yacine MA Bands Mod
Mashed together the ema-bands from IvanLabrie with some moving average script stuff from ChrisMoody and LazyBear and this is the result. Credit goes to them, 'cause I don't know to how to code tbh. Just copy/pasted stuff untill I got the result I wanted.
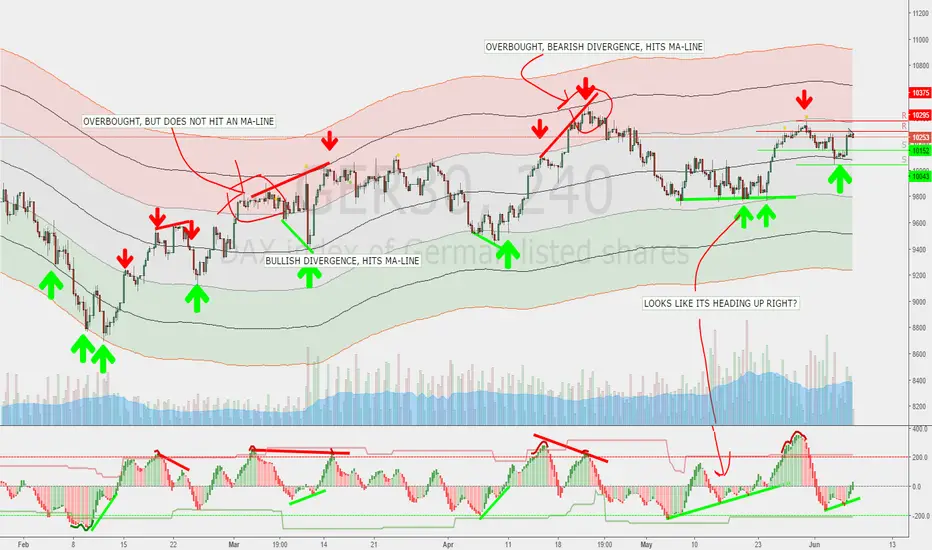
Bands work as support/resistance among other things. You can use them to trade breakouts or reversals or whatever.
Combining them with a momentum indicator would probably be useful for timing divergence or OB/OS and stuff like that.
Included moving average types;
Not sure if all of them works as they should... y'know since I cant code/script. Looks good to me though.¨
Default should work pretty good for the DAX, But you'll probably want to fiddle a bit with the settings.
Here's a pic of how they can be used. Ofc everything looks simple in hindsight, but you get the point.

Bands work as support/resistance among other things. You can use them to trade breakouts or reversals or whatever.
Combining them with a momentum indicator would probably be useful for timing divergence or OB/OS and stuff like that.
Included moving average types;
- SMA
EMA
RMA
WMA
VWMA
HullMA
TilsonMA
TEMA
Not sure if all of them works as they should... y'know since I cant code/script. Looks good to me though.¨
Default should work pretty good for the DAX, But you'll probably want to fiddle a bit with the settings.
Here's a pic of how they can be used. Ofc everything looks simple in hindsight, but you get the point.
Script open-source
In pieno spirito TradingView, il creatore di questo script lo ha reso open-source, in modo che i trader possano esaminarlo e verificarne la funzionalità. Complimenti all'autore! Sebbene sia possibile utilizzarlo gratuitamente, ricorda che la ripubblicazione del codice è soggetta al nostro Regolamento.
Declinazione di responsabilità
Le informazioni ed i contenuti pubblicati non costituiscono in alcun modo una sollecitazione ad investire o ad operare nei mercati finanziari. Non sono inoltre fornite o supportate da TradingView. Maggiori dettagli nelle Condizioni d'uso.