PROTECTED SOURCE SCRIPT
Koalafied Donchian Channel Width

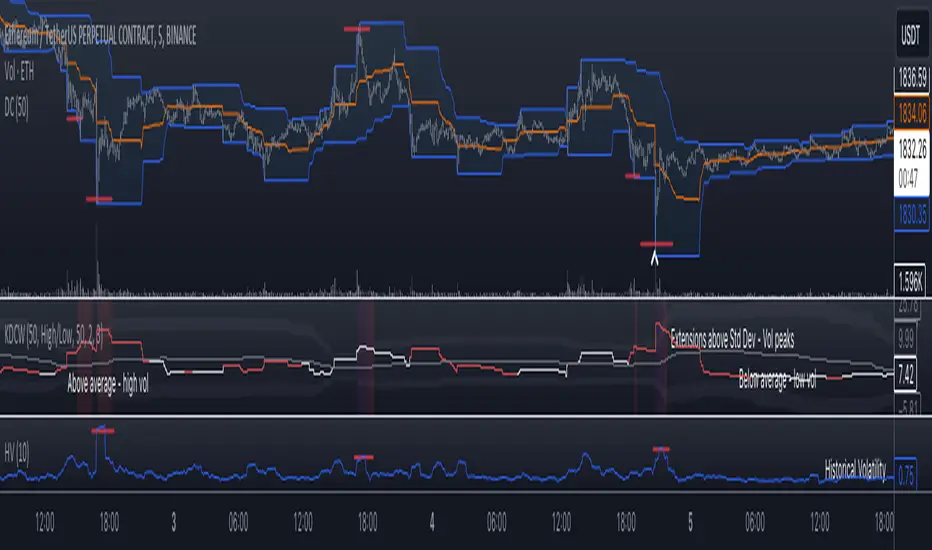
Donchian Channel Width indicator with average channel width value and Standard Deviations shown.
Experimental gauge of volatility. Channel Width greater than average over lookback period shows higher levels of volatility, whereas channel width below average is correlated to low historical volatility. Extensions of width over user selected standard deviations show peaks in volatility.
Unique as average channel width is taken from array of value changes updating only when prior high/lows are breached instead of bar by bar like similar indicators.
Size of array (lookback) is user adjustable.
Script protetto
Questo script è pubblicato come codice protetto. Tuttavia, è possibile utilizzarle liberamente e senza alcuna limitazione – ulteriori informazioni qui.
Declinazione di responsabilità
Le informazioni e le pubblicazioni non sono intese come, e non costituiscono, consulenza o raccomandazioni finanziarie, di investimento, di trading o di altro tipo fornite o approvate da TradingView. Per ulteriori informazioni, consultare i Termini di utilizzo.