OPEN-SOURCE SCRIPT
Aggiornato Dual Volume Divergence Index [DW]
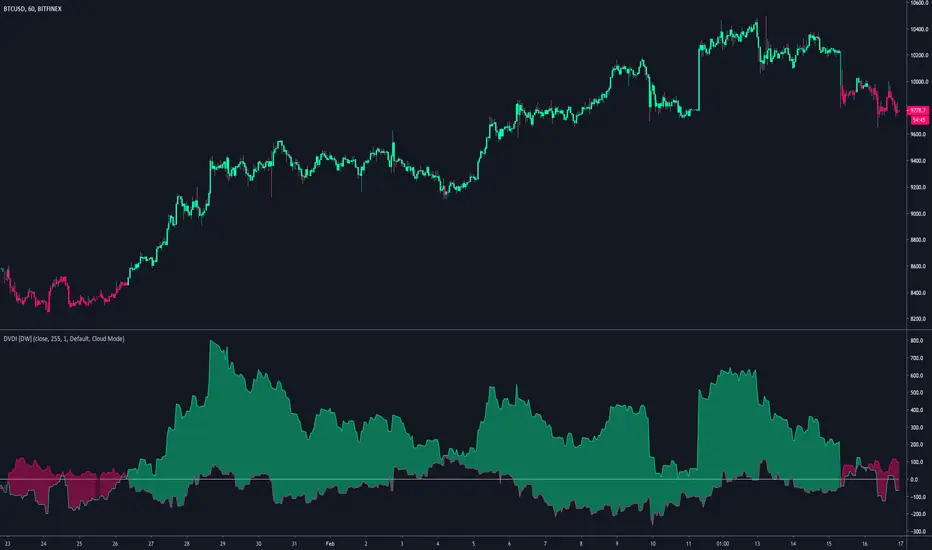
This is an experimental variation of Paul L. Dysart's Positive Volume Index and Negative Volume Index that tracks the divergences between the PVI and its EMA, and the NVI and its EMA, then plots both together for comparison.
This tool can be used to identify trending price activity.
This tool can be used to identify trending price activity.
Note di rilascio
Simple update: Added custom bar colorization.
Note di rilascio
Simple update:Updated color scheme based on PVI and NVI divergence strength.
Note di rilascio
Updates:Added optional smoothing to the script using an exponential moving average to filter noisy outputs.
Added a mode selection with three modes to choose from:
- Dual Index Mode, which displays the original DVDI
- Oscillator Mode, which displays the difference between the PVDI and NVDI as a centered oscillator
- Bar Counter Mode, which displays the number of bars in which volume divergence is in a positive dominant phase and negative dominant phase
Note di rilascio
Updates:Migrated code from pine v2 to pine v3.
Added a source price input.
Added an option to use tick volume rather than real volume. If the chart being analyzed has no real volume component, use tick volume.
Condensed DVDI's operations into a singular function for optimized performance.
Fixed a small issue with the bar counter.
Mode selection is now an easy to use dropdown menu.
Color schemes have been updated for greater detail.
Note di rilascio
Updates:-> Migrated to v4.
-> Updated DVDI function.
-> Corrected NaN values to stabilize initial conditions.
-> Reorganized script structure.
-> Revamped color scheme.
Script open-source
In pieno spirito TradingView, il creatore di questo script lo ha reso open-source, in modo che i trader possano esaminarlo e verificarne la funzionalità. Complimenti all'autore! Sebbene sia possibile utilizzarlo gratuitamente, ricorda che la ripubblicazione del codice è soggetta al nostro Regolamento.
For my full list of premium tools, check the blog:
wallanalytics.com/
Reach out on Telegram:
t.me/DonovanWall
wallanalytics.com/
Reach out on Telegram:
t.me/DonovanWall
Declinazione di responsabilità
Le informazioni ed i contenuti pubblicati non costituiscono in alcun modo una sollecitazione ad investire o ad operare nei mercati finanziari. Non sono inoltre fornite o supportate da TradingView. Maggiori dettagli nelle Condizioni d'uso.