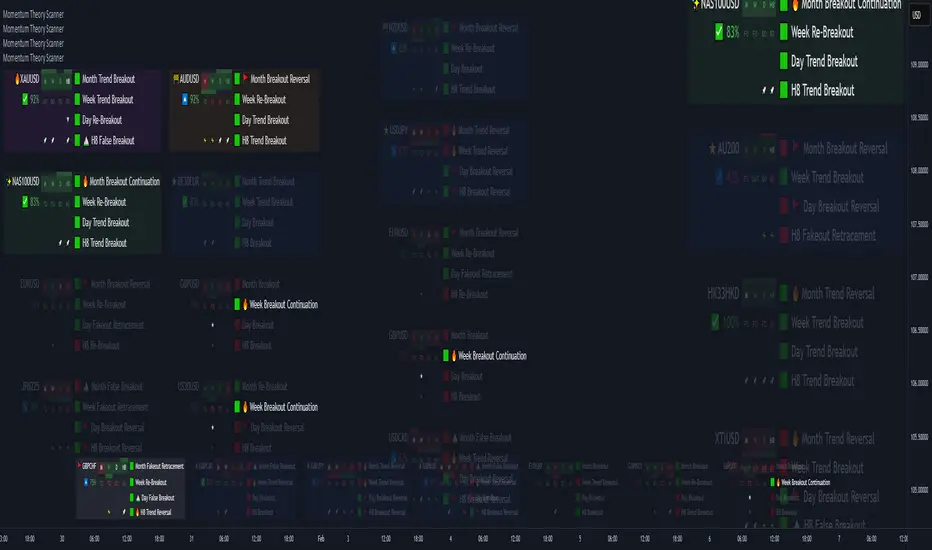
Momentum Theory Scanner
✅ 8 Symbol Watchlist Scanner
✅ Mechanical Setups for Ranges, Continuations, Reversals
✅ For Scalpers, Day Traders, and Swing Traders
⚠️ Momentum Theory Scanner searches for assets that have the ideal conditions to trade a specific setup. They are NOT signals to be taken blindly without further analysis.
--- 📷 INDICATOR GALLERY ---
--- ⚡ FEATURES ---
✔ Multi-Timeframe Analysis
Displays various higher timeframe information in order to read how an asset is moving with one quick glance. Utilizes icons that serve as visual cues.
- Watchlist Pair - Symbol in the watchlist
- Setup Type - Shows the icon of what setup has been found
⭐ Trend Breakout
✨ Trend Breakout (Continuation)
🔥 Continuation
🚧 Range
🚩 Reversal- Quick Analysis - Displays bullish / bearish confluence based on breakout / peak bias
↗️↘️ Breakout Bias Alignment
🔼🔽 Peak Bias Alignment
🔀 Breakout and Peak Bias Alignment, but opposite
✅ Breakout and Peak Bias Alignment- Previous Bar Close - Shows how the previous bar closed
[BO] Breakout
[FO] Fakeout
[IN] Inside
[OUT] Outside- Trigger Type - Shows whether there is a peak breakout or fakeout
⚡ Peak Fakeout
🚀 Peak Breakout- Breakout Continuation - Shows if a timeframe has pulled back to the breakout level
▲▼ Counter-Trend Breakout
★ Breakout Continuation- Momentum Cycles - Shows which part of the momentum cycle price is currently in
🚩 Breakout Reversal
⛰️ False Breakout
🔥 Trend Reversal / Breakout Continuation- Breakout / Peak Bias - Shows the breakout level bias and if the peak has been triggered
✔ Levels Analysis
Hover over the symbol name to view which timeframe levels are bullish or bearish and if peak levels have been triggered.
✔ Built-In Presets
Create your own custom watchlist or use one of the built-in ones (using Oanda charts)
It's recommended to use the same source for all assets in your watchlist whenever possible
✔ Plug-and-Play
Automatically changes the relevant levels depending on the viewed timeframe. Just fill in your watchlist, add it to your chart, and start trading!
Set the indicator to the following timeframes to view those setups. When the momentum timeframe's peak is triggered, the watchlist state changes.
- Month Timeframe - 12M / 6M / 3M / Month Momentum
- Week Timeframe - 6M / 3M / M / Week Momentum
- H1 Timeframe - 3M / M / W / Day Momentum
- M20 Timeframe - M / W / D / H12 Momentum
- M15 Timeframe - M / W / D / H8 Momentum
- M10 Timeframe - M / W / D / H4 Momentum
- M5 Timeframe - W / D / H8 / H2 Momentum
- M3 Timeframe - D / H8 / H4 / H1 Momentum
--- 🧰 WATCHLIST STATES ---
⭐ Trend Breakout Setup
✨ Trend Breakout (Continuation) Setup
🔥 Continuation Setup
🚧 Range Setup
🚩 Reversal Setup
✔ Signal Bar
Ideal conditions to trade this setup are present, but has not met full setup criteria yet
✔ Signal Cycle
Asset has pulled back towards breakout level and possibly getting ready for a continuation
✔ No Setups
--- 💡 MOMENTUM THEORY CONCEPT ---
The best trade setups are found at swing points for 3 reasons:
- They are the highest probability point the market will continue pushing.
- They provide the best Stop Loss protection.
- They offer the greatest Risk-to-Reward.
The goal of trading is to identify when these swing points occur to take the best trade setups.
Every swing point consists of a push towards a peak, a peak formation, and a push away from a peak. There is no way to know how long a push towards or away from a peak will last, but the peak formation can be identified by 2 elements:
- A fakeout of a previous peak level
- A flip of its last breakout level
We can track the movement of the market by looking at which peak level is triggered relative to its breakout level. How price behaves at the previous peak levels shows where momentum is headed. It continues to build towards a new peak until it fakes out the previous peak level and flips its breakout level, creating a swing point.
Swing points on the higher timeframes show up as multiple swing points on the lower timeframes, but they often won't be moving in sync. When 2 timeframe swing points get in alignment, the market will move smoothly together. You find the lower timeframe swing point the exact same way you find the higher timeframe one.
The market is constantly moving from one swing point to the next in a repeatable cycle. By using higher timeframe breakout levels and peak levels triggered, we can track where we are in this cycle to anticipate its future movement. This is the Momentum Cycle and it repeats itself over and over.
By using the exact same concept, we can identify mechanical alignment patterns on the lower timeframes to create setups that work in every phase of the market cycle. Momentum Theory Scanner searches for these patterns inside the watchlist.
✔ Range Setups
✔ Continuation Setups
✔ Reversal Setups
--- 📝 HOW TO USE ---
⚠ Click on "Indicators > Invite-Only > Momentum Theory Scanner" to add it to your charts.
1) Create your watchlist or use one of the built-in presets and place it on the timeframe you want to scan for setups (see Features above).
Put multiple together if you want more than 8 items in the watchlist. If you don't want to see the price chart, go to "Object Tree and Data Window" and turn off chart visibility.
2) Signal bars / cycles indicate that ideal conditions exist, but are not fully triggered yet. These are the pairs that should initially be focused on.
3) Setups will trigger in real-time and push to the top of the column.
⚠️ Momentum Theory Scanner searches for assets that have the ideal conditions to trade a specific setup. They are NOT signals to be taken blindly without further analysis.
- Major update will be coming soon!
- Updated Momentum Cycles
- Added Trade Setups
- Added Uni-Directional and Swing Points
Script su invito
Solo gli utenti approvati dall'autore possono accedere a questo script. È necessario richiedere e ottenere l'autorizzazione per utilizzarlo. Tale autorizzazione viene solitamente concessa dopo il pagamento. Per ulteriori dettagli, seguire le istruzioni dell'autore riportate di seguito o contattare direttamente nohypetrader.
TradingView NON consiglia di acquistare o utilizzare uno script a meno che non si abbia piena fiducia nel suo autore e se ne comprenda il funzionamento. È inoltre possibile trovare alternative gratuite e open source nei nostri script della community.
Istruzioni dell'autore
⚡ Momentum Theory subscription available at whop.com/nohypetrader/
🏆 More Info - patreon.com/posts/momentum-theory-121307513
Declinazione di responsabilità
Script su invito
Solo gli utenti approvati dall'autore possono accedere a questo script. È necessario richiedere e ottenere l'autorizzazione per utilizzarlo. Tale autorizzazione viene solitamente concessa dopo il pagamento. Per ulteriori dettagli, seguire le istruzioni dell'autore riportate di seguito o contattare direttamente nohypetrader.
TradingView NON consiglia di acquistare o utilizzare uno script a meno che non si abbia piena fiducia nel suo autore e se ne comprenda il funzionamento. È inoltre possibile trovare alternative gratuite e open source nei nostri script della community.
Istruzioni dell'autore
⚡ Momentum Theory subscription available at whop.com/nohypetrader/
🏆 More Info - patreon.com/posts/momentum-theory-121307513