PROTECTED SOURCE SCRIPT
Manipulation Candle 15m
Manipulation Candle
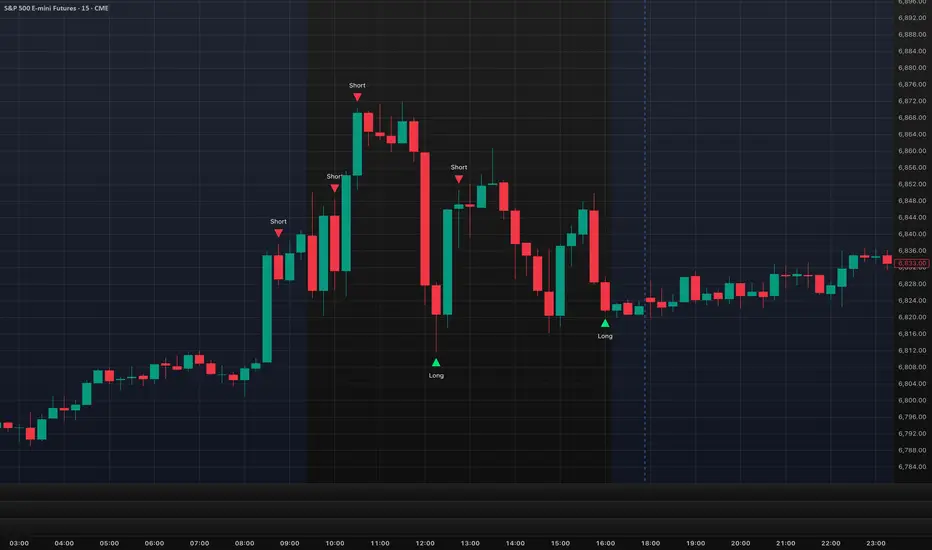
The Manipulation Candle 15m indicator is designed to highlight potential market manipulation or exhaustion moves on the 15-minute chart by identifying large impulsive candles relative to the Daily ATR and fading them contrarian-style.
This tool is especially useful for index futures, SPX options, and high-liquidity instruments where sharp moves often precede mean reversion.
How It Works -
The script monitors completed 15-minute candles
It measures the candle body size (open → close)
That body is compared to a user-defined percentage of the Daily ATR (set to 20%)
When a candle exceeds the threshold, it is considered an impulse / manipulation candle
Signal Logic (Contrarian Bias) -
Bearish impulse candle → LONG signal
Indicates aggressive selling that may be exhausted
Bullish impulse candle → SHORT signal
Indicates aggressive buying that may be overextended
Signals are only generated once per completed 15-minute candle to avoid repainting.
Inputs -
Daily ATR Length
Controls how volatility is measured
Impulse Threshold (% of ATR)
Defines how large a candle must be (relative to Daily ATR) to trigger a signal
Best Use Cases
Mean-reversion and fade strategies
SPX / ES / NQ / YM indices
Important Notes
This is not a standalone system
Works best with context, confirmation, and risk management
Designed to identify potential turning points, not trend continuation
Created by: aaronrileycheer
Timeframe: 15-Minute
Style: Contrarian / Mean Reversion
Script protetto
Questo script è pubblicato come codice protetto. Tuttavia, è possibile utilizzarle liberamente e senza alcuna limitazione – ulteriori informazioni qui.
Declinazione di responsabilità
Le informazioni e le pubblicazioni non sono intese come, e non costituiscono, consulenza o raccomandazioni finanziarie, di investimento, di trading o di altro tipo fornite o approvate da TradingView. Per ulteriori informazioni, consultare i Termini di utilizzo.