OPEN-SOURCE SCRIPT
Moving Average Colored EMA/SMA
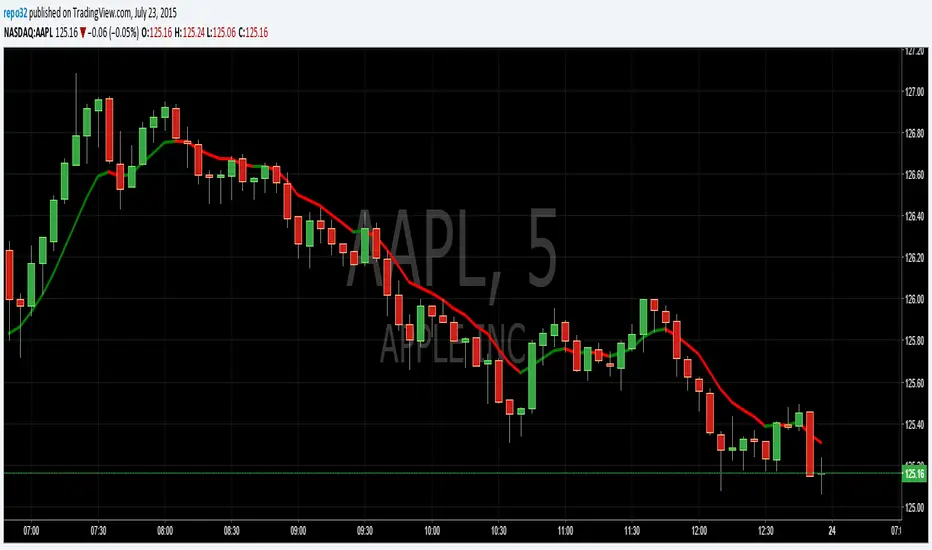
This script will give you the ability to put an EMA and/or SMA on the chart that changes color based upon the direction. Default at startup is EMA visible and SMA hidden. When the MA is moving up, it is green. When the MA is moving down, it is red. You can change the color to whatever you like.
Script open-source
In pieno spirito TradingView, il creatore di questo script lo ha reso open-source, in modo che i trader possano esaminarlo e verificarne la funzionalità. Complimenti all'autore! Sebbene sia possibile utilizzarlo gratuitamente, ricorda che la ripubblicazione del codice è soggetta al nostro Regolamento.
Declinazione di responsabilità
Le informazioni ed i contenuti pubblicati non costituiscono in alcun modo una sollecitazione ad investire o ad operare nei mercati finanziari. Non sono inoltre fornite o supportate da TradingView. Maggiori dettagli nelle Condizioni d'uso.