Technical Analysis Notes
- In the process of monitoring the list of trading pairs such as stocks, cryptocurrencies... I often mark signals such as: RSI divergence, MACD, Stochatic, RSI trendline, Trendline..."by hand" , like recording on a drawing board, or excell, notepad... Therefore, taking notes is very limited. In addition, each time frame gives different, inconsistent signals and it is difficult to analyze the trend of a trading pair. somehow.
- After a period of careful research, I created the "Technical Analysis notes" indicator to solve the problems mentioned above, and after using it, I personally found it very effective to mark it. Trading signals as well as trend analysis across time frames from small to large.
- For example: On weekends, I often use automatic scanning indicators (about 200 codes) RSI divergence, RSI trendline, Trendlines, MACD-histogram .. within a week, then mark trading pairs when there are signals. Signals such as RSI cutting its trend line, price breaking through the trend line, Histogram MACD divergence... in the weekly frame, from there look to the D1, H4 frames to see the next signals in those frames to find the direction of intersection. Move in the same direction as the weekly frame signal to trade in the same trend. From that analysis, I limit my ability to go against the trend, and wait patiently for the signals that have been noted before.
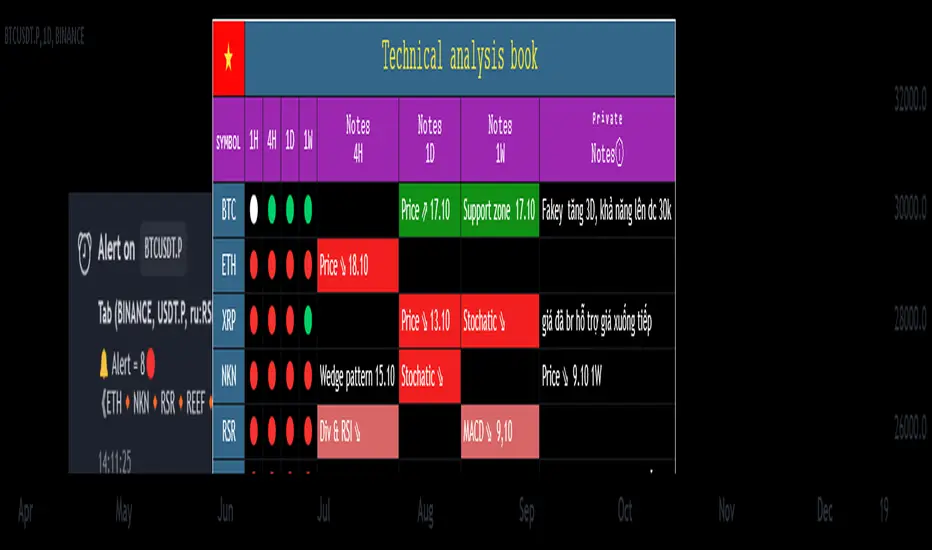
- On this board you can monitor 10 transaction codes (in real time)
- On this table I have given 4 different time frames (can be customized in settings)
- I add Kumo Cloud (ichimoku) signals on 4 time frames so that people can easily recognize the trend when the price is above the cloud (green circle), in the cloud (white circle), below the cloud (green circle). red circle)
- I add fast typing mode, shortcut typing depending on each person's description including 16 fast typing modes (for example: "ru:RSI br up" in my understanding means the RSI line has broken above the trend line direction)
- From the above example "ru:RSI br up" the sign ' : ' is the separator that must be present to interpret the word 'ru' as being typed quickly, and 'RSI br up' is the part that explains the content of that word typed quickly.
- In those 16 quick typing boxes (divided into 4 rows), the first 3 rows are colored with custom boxes for each person. The last remaining row is not filled.
- The content of note boxes can be hidden in the settings using the check box.
- In particular, the private notes column cannot be hidden, because it is the column for recording, synthesizing, analyzing, identifying main trends, or waiting points to place orders... (This box is the most important in my opinion. ..)
- Has a super smart warning mode (customizable) when Kumo cloud signals are in the same color on 4 time frames for the most certain trend (green - bullish, red - bearish)
- In the warning section, you can adjust from 4 time frames to 3 time frames, 2 time frames, 1 time frame.
- Alert mode lists exact code names when one or more codes qualify. (eg BTC, ADA, BNB...)
--------------------------------------------------------------------------------------------------------------------
👉 Vietnamess
- Trong quá trình theo dõi danh sách các cặp giao dịch như cổ phiếu, tiền điện tử...tôi thường đánh dấu các tín hiệu như : phân kì RSI, MACD, Stochatic, trendline RSI, Trendline ..."bằng tay", như ghi trên bảng vẽ, hoặc excell, notepad...Vì vậy ghi chép rất hạn chế ngoài ra mỗi khung thời gian cho các tín hiệu khác nhau, không đồng nhất và rất khó để phân tích xu hướng của một cặp giao dịch nào đó.
- Sau một thời gian nghiên cứu kĩ lưỡng tôi có lập lên được chỉ báo "ghi chép Phân tích kĩ thuật " nhằm giải quyết các vấn đề nêu như trên, và sau quá trình dùng, cá nhân tôi thấy rất hiệu quả khi đánh dấu các tín hiệu giao dịch cũng như phân tích xu hướng qua các khung thời gian từ nhỏ đến lớn.
- Ví dụ: Cuối tuần tôi thường dùng chỉ báo quét tự động(khoảng 200 mã) RSI phân kì, RSI trendline, Trendlines , MACD-histogram .. trong khung 1 tuần, sau đó đánh dấu những cặp giao dịch khi có những tín hiệu như RSI cắt đường xu hướng của nó, giá đột phá đường xu hướng, phân kì Histogram MACD.. trong khung tuần, từ đó tìm đến những khung D1,H4 xem các tín hiệu tiếp theo trong các khung đó để tìm hướng giao dịch cùng hướng với tín hiệu khung tuần để giao dịch cùng xu hướng. Từ những phân tích đó tôi hạn chế được đi ngược xu hướng, và kiên nhẫn chờ đợi khi có tín hiệu được đã ghi chú từ trước.
- Trên bảng này có thể theo õi được 10 mã giao dịch(theo thời gian thực)
- Trên bảng này tôi có đưa ra 4 khung thời gian khác nhau(có thể tùy chỉnh trong thiết lập)
- Tôi đưa thêm tín hiệu Mây Kumo( ichimoku) trên 4 khung thời gian để mọi người từ đó dễ dàng nhận biết xu hướng khi giá trên mây(dấu tròn xanh lá) , trong mây(dấu tròn trắng) , dưới mây(dấu tròn đỏ)
- Tôi đưa thêm chế độ gõ nhanh, gõ tắt tùy theo diễn tả của mỗi người gồm 16 chế độ gõ nhanh (ví dụ: "ru:RSI br up" theo ý hiểu của tôi là đường RSI đã phá vỡ lên trên đường xu hướng)
- Từ ví dụ trên "ru:RSI br up" dấu ' : ' là ngăn cách phải có để diễn giải từ 'ru' là gõ nhanh, còn 'RSI br up' là phần diễn giải nội dung của từ gõ nhanh đó
- Trong 16 ô gõ nhanh đó(được chia làm 4 hàng) có 3 hàng đầu được tô màu ô tùy chỉnh cầu mỗi người. hàng cuối cùng còn lại không được tô.
- Nội dung các ô ghi chú có thể được ẩn hiện trong mục cài đặt bằng ô dấu tích.
- Đặc biệt cột ghi chú riêng tư không ẩn được, vì đó là cột ghi chép, tổng hợp , phân tích , nhận định xu hướng chính, hay điểm chờ để đặt lệnh...(ô này theo tôi là quan trọng nhất...)
- Có chế độ cảnh báo siêu thông minh(có thể tùy chỉnh) khi tín hiệu mây Kumo cùng trên 4 khung thời gian cùng màu cho xu hướng chắc chắn nhất(xanh- tăng giá, đỏ- giảm giá)
- Trong mục cảnh báo có thể điều chỉnh từ 4 khung thời gian xuống còn 3 khung thời gian, 2 khung thời gian, 1 khung thời gian.
- Chế độ cảnh báo được liệt kê tên mã chính xác khi một hay nhiều mã đủ điều kiện .(ví dụ BTC , ADA , BNB...)
Script su invito
Solo gli utenti approvati dall'autore possono accedere a questo script. È necessario richiedere e ottenere l'autorizzazione per utilizzarlo. Tale autorizzazione viene solitamente concessa dopo il pagamento. Per ulteriori dettagli, seguire le istruzioni dell'autore riportate di seguito o contattare direttamente ichimoku14642.
TradingView NON consiglia di pagare o utilizzare uno script a meno che non ci si fidi pienamente del suo autore e non si comprenda il suo funzionamento. Puoi anche trovare alternative gratuite e open-source nei nostri script della comunità.
Istruzioni dell'autore
Attenzione: prima di richiedere l'accesso, leggi la nostra guida per gli script su invito.
Declinazione di responsabilità
Script su invito
Solo gli utenti approvati dall'autore possono accedere a questo script. È necessario richiedere e ottenere l'autorizzazione per utilizzarlo. Tale autorizzazione viene solitamente concessa dopo il pagamento. Per ulteriori dettagli, seguire le istruzioni dell'autore riportate di seguito o contattare direttamente ichimoku14642.
TradingView NON consiglia di pagare o utilizzare uno script a meno che non ci si fidi pienamente del suo autore e non si comprenda il suo funzionamento. Puoi anche trovare alternative gratuite e open-source nei nostri script della comunità.
Istruzioni dell'autore
Attenzione: prima di richiedere l'accesso, leggi la nostra guida per gli script su invito.