OPEN-SOURCE SCRIPT
Aggiornato Centred Moving Average
Based around the Centered Moving Average as published by Vailant-Hero this script is revised and improved to aid with execution time & server load. For full description follow the link as above, as Valiant-Hero explains the idea perfectly well.
While the original script worked fine for small values of length, once length was extended significantly or chart timeframe set to short values then the script is prone to exceeding computation requirements. The original script was attempting to delete and re-draw (length x 3) lines on the chart for each tick. In addition to server load, once length is greater than 167 (500/3) then the first drawn lines start disappearing, so the predicted values no longer appear connected to the offset averages calculated from the candle data. A further error resulted with larger values of "length" and future data selected, in that the script would try and move lines more than 500 bars into the future.
Improvements and major code changes
- All values for the predicted moving average lines are calculated from a single run through of the data, rather than having to loop back through the data "length" times (and then through it again "length" times if you selected double moving average). Each loop also inefficiently calculated the sum of "length" values by recalling each one individually.
- Number of lines are thus reduced so that we're never attempting to plot more than "max_lines_count" onto the chart. User is able to select the granularity of the lines - more sections will mean a smoother line but at the expense of processing speed.
- No matter the combination of "length" and the selected granularity of the lines, no line will be drawn if its endpoint would be more than 500 bars in the future.
- Code for "Double SMA" only affected the predicted data values, rather than affecting the historic calculations (and standard deviation calcs) as well as the predictions. This has been included and results in much smoother lines when "Double Moving Average" is selected.
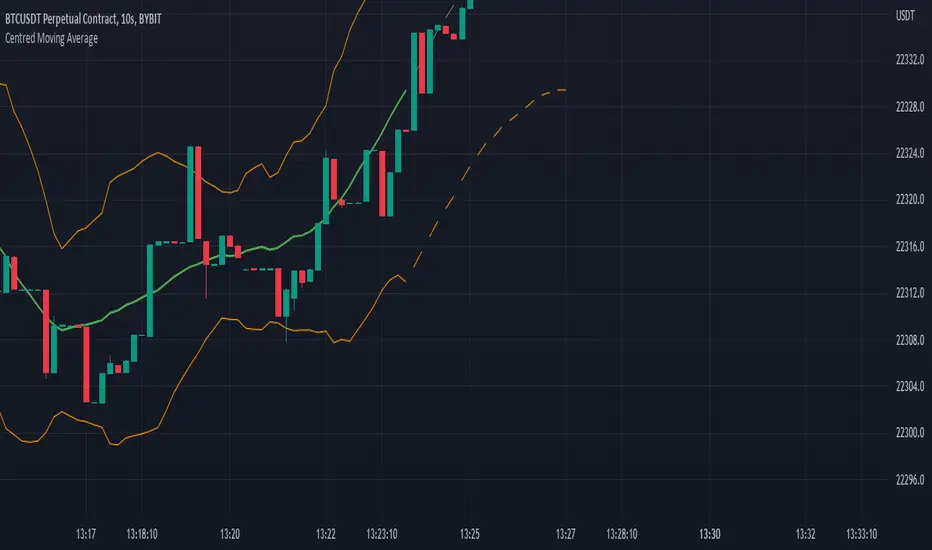
- Striped lines for the predicted values - firstly to make it obvious where the "predictions" begin, and also because they look funky.
Note di rilascio
Minor code update such that predicted values are only calculated on the last bar - as they're not needed before that point. Hopefully further improve execution times.Note di rilascio
Thanks to BarefootJoey for the bug report - odd values for length now calculate without throwing an error.Also built in some more configuration options from a screenshot they showed me where the lines were dashed rather than striped. So there's now a config option for dashed lines, which will also reduce the script overhead.
Still seeing occasional errors with the amount of computing power when length is set to huge numbers (> 1000) so the next edition may be a rewrite to only delete / move lines if they have actually changed position rather than needlessly deleting and redrawing on each tick.
Script open-source
In pieno spirito TradingView, il creatore di questo script lo ha reso open-source, in modo che i trader possano esaminarlo e verificarne la funzionalità. Complimenti all'autore! Sebbene sia possibile utilizzarlo gratuitamente, ricorda che la ripubblicazione del codice è soggetta al nostro Regolamento.
Declinazione di responsabilità
Le informazioni ed i contenuti pubblicati non costituiscono in alcun modo una sollecitazione ad investire o ad operare nei mercati finanziari. Non sono inoltre fornite o supportate da TradingView. Maggiori dettagli nelle Condizioni d'uso.