High Time Frame Candles [TakingProphets]
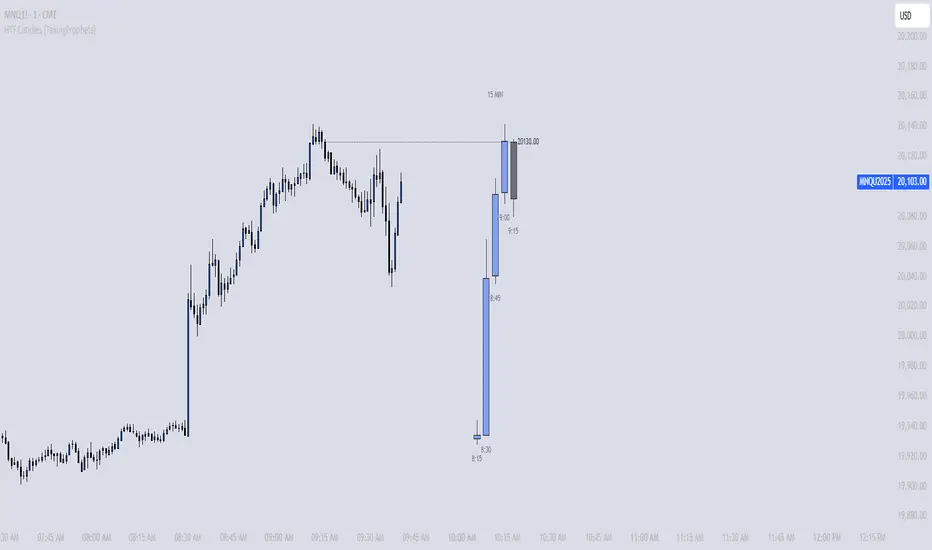
Stay aligned with institutional context by visualizing higher timeframe (HTF) candles directly on your lower timeframe chart. This tool combines HTF structure, SMT divergence detection, and real-time projections of Open, High, Low, and Close levels — all in a clean, customizable package.
What It Does
🟩 Plots HTF Candles — See up to 10 higher timeframe candles rendered on your chart, offset to the right for a clutter-free view.
⏱️ HTF Close Timer — Know exactly when the current HTF candle is about to close.
🔀 SMT Divergence Detection — Automatically highlights bearish or bullish SMT setups by comparing your chart against a correlated instrument (default: CME_MINI:ES1!).
📊 Real-Time Projections — Projects the current HTF candle’s Open, High, Low, and Close levels forward, with optional price labels for precision trading.
Key Features
🎛 Configurable Candle Rendering
Adjustable width, transparency, offsets, colors, and label sizes.
Choose any HTF — from 1 minute to 1 month.
🕒 Custom Time Labels
Displays HH:MM timestamps for intraday or dates for higher frames.
Supports both 12-hour and 24-hour formats.
🔍 Smart Money Divergence (SMT)
Detects historical and real-time SMT setups automatically.
Optional labels, fully customizable colors, line styles, and widths.
Comes with built-in alert conditions for instant notifications.
📈 HTF Candle Projections
Draws Open, High, Low, and Close levels from the start of the current HTF period.
Labels price points with customizable sizes, colors, and styles.
Inputs Overview
Timeframe Settings → Select the HTF for plotting.
Display Settings → Number of candles, offset, width, transparency, time labels, and size.
Visual Settings → Custom bullish/bearish colors, borders, and wick styles.
SMT Settings → Enable SMT, choose correlated asset, tweak colors, lines, and alerts.
Projection Settings → Toggle Open/High/Low/Close projections, customize line styles, widths, and labels.
Alerts 🔔
Built-in alerts let you stay ahead of SMT divergence in real-time:
Bullish SMT → Divergence detected between main and correlated asset lows.
Bearish SMT → Divergence detected between main and correlated asset highs.
Bullish Real-Time SMT → Live SMT divergence forming.
Bearish Real-Time SMT → Live SMT divergence forming.
Pro Tips
⚡ Best used on lower timeframe charts to see HTF structure while trading intraday setups.
🎯 Keep displayed candles limited (e.g., 3–6) for cleaner visuals and better performance.
🔗 Ensure your correlated SMT symbol has real-time data access on TradingView for accurate comparisons.
Script su invito
Solo gli utenti approvati dall'autore possono accedere a questo script. È necessario richiedere e ottenere l'autorizzazione per utilizzarlo. Tale autorizzazione viene solitamente concessa dopo il pagamento. Per ulteriori dettagli, seguire le istruzioni dell'autore riportate di seguito o contattare direttamente TakingProphets.
TradingView NON consiglia di pagare o utilizzare uno script a meno che non ci si fidi pienamente del suo autore e non si comprenda il suo funzionamento. Puoi anche trovare alternative gratuite e open-source nei nostri script della comunità.
Istruzioni dell'autore
Attenzione: prima di richiedere l'accesso, leggi la nostra guida per gli script su invito.
Declinazione di responsabilità
Script su invito
Solo gli utenti approvati dall'autore possono accedere a questo script. È necessario richiedere e ottenere l'autorizzazione per utilizzarlo. Tale autorizzazione viene solitamente concessa dopo il pagamento. Per ulteriori dettagli, seguire le istruzioni dell'autore riportate di seguito o contattare direttamente TakingProphets.
TradingView NON consiglia di pagare o utilizzare uno script a meno che non ci si fidi pienamente del suo autore e non si comprenda il suo funzionamento. Puoi anche trovare alternative gratuite e open-source nei nostri script della comunità.
Istruzioni dell'autore
Attenzione: prima di richiedere l'accesso, leggi la nostra guida per gli script su invito.