PROTECTED SOURCE SCRIPT
Standard Deviation Bands
## 📊 Standard Deviation Bands (SDB) - Multi-Layer Statistical Channel Indicator
### 🎯 Overview
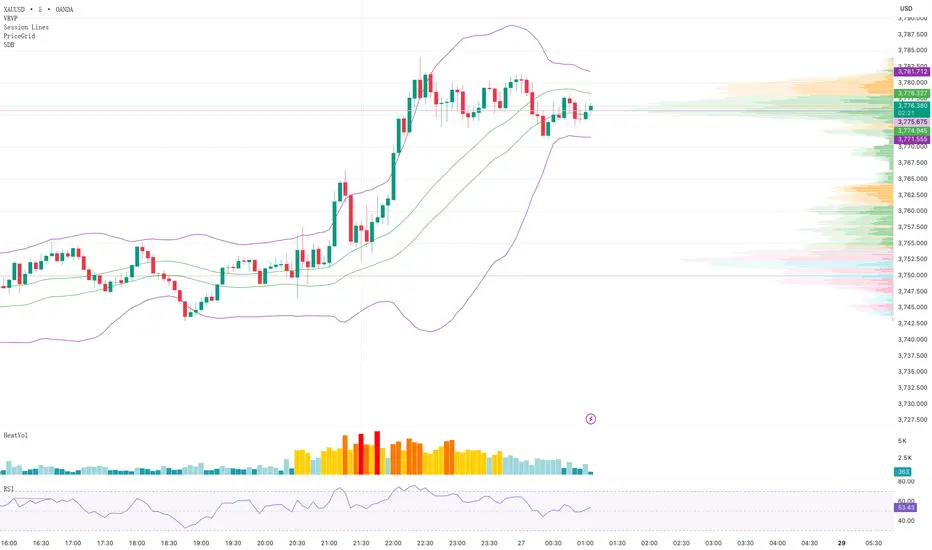
The Standard Deviation Bands indicator is a sophisticated technical analysis tool based on statistical principles that creates dynamic support and resistance channels by calculating price standard deviations. Unlike traditional Bollinger Bands, this indicator employs a **separate high-low calculation approach**, providing more precise boundary positioning for upper and lower bands.
### ✨ Key Features
**🔹 Separate High-Low Algorithm**
- Upper bands calculated using High price moving averages and standard deviations
- Lower bands calculated using Low price moving averages and standard deviations
- Delivers more accurate price boundary identification
**🔹 Multi-Layer Standard Deviation Levels**
- **±1σ**: Basic standard deviation channel for capturing regular price fluctuations
- **±1σ±2σ**: Dual-layer channels for identifying medium-strength support/resistance
- **±1σ±2σ±3σ**: Triple-layer channels providing complete price volatility analysis framework
**🔹 Flexible Moving Average Options**
- SMA (Simple Moving Average)
- EMA (Exponential Moving Average)
- WMA (Weighted Moving Average)
- RMA (Rolling Moving Average)
- VWMA (Volume Weighted Moving Average)
### 🛠️ Parameter Configuration
| Parameter | Default | Description |
|-----------|---------|-------------|
| Length | 30 | Calculation period length |
| Multiplication Factor | 1.8 | Standard deviation multiplier |
| Top Band Input Data | High | Data source for upper bands |
| Bottom Band Input Data | Low | Data source for lower bands |
| Moving Average Type | SMA | Type of moving average |
| Show Levels | ±1σ | Standard deviation levels to display |
| Show Bands | true | Whether to display channel lines |
| Show Moving Averages | true | Whether to display basis moving averages |
### 📈 Trading Applications
**Support & Resistance Identification**
- Monitor selling opportunities when price approaches upper bands
- Look for buying opportunities when price approaches lower bands
- Multi-layer channels provide different strength support/resistance references
**Trend Strength Assessment**
- Channel width reflects market volatility
- Price breakouts beyond outer channels may signal strong trends
- Price oscillation within inner channels indicates consolidation
**Entry Timing Optimization**
- Combine with candlestick patterns at channel boundaries for reversal signals
- Post-breakout pullbacks provide low-risk entry opportunities
- Enhanced effectiveness when used across multiple timeframes
### 🎨 Visual Design
- Purple 1σ channel lines for clear primary support/resistance identification
- Orange 2σ channel lines marking medium-strength boundaries
- Green 3σ channel lines indicating extreme value boundaries
- Customizable colors and line widths to suit different chart styles
### 💡 Usage Recommendations
1. **Period Selection**: Use 15-30 periods for short-term trading, 50-100 for medium-long term
2. **Multiplier Adjustment**: Increase multiplier for high-volatility instruments, decrease for stable ones
3. **Level Selection**: Beginners should start with ±1σ, advance to multi-layer after gaining experience
4. **Combined Usage**: Enhanced effectiveness when combined with volume, RSI, and other indicators
### 🔧 Technical Advantages
- Built on solid statistical mathematical foundation
- Separate high-low calculations provide more precise boundary positioning
- Multi-layer design adapts to different trading styles
- Flexible parameter adjustment suitable for various market conditions
---
**Applicable Markets**: Stocks, Forex, Cryptocurrencies, Futures, and all financial markets
**Applicable Timeframes**: 1-minute to monthly charts
**Skill Level**: Beginner to advanced traders
*Disclaimer: This indicator is for technical analysis reference only and does not constitute investment advice. Trading involves risks; invest cautiously.*
Script protetto
Questo script è pubblicato come codice protetto. Tuttavia, è possibile utilizzarle liberamente e senza alcuna limitazione – ulteriori informazioni qui.
Declinazione di responsabilità
Le informazioni e le pubblicazioni non sono intese come, e non costituiscono, consulenza o raccomandazioni finanziarie, di investimento, di trading o di altro tipo fornite o approvate da TradingView. Per ulteriori informazioni, consultare i Termini di utilizzo.