PROTECTED SOURCE SCRIPT
Aggiornato TRADE ORBIT:INVESTMENT INDICATOR
Key Features:
Relative Strength vs NIFTY
Monthly RS(12): Measures how the symbol is performing relative to NIFTY over the past 12 months.
Positive RS indicates the symbol is outperforming the benchmark.
Momentum Filter (Weekly RSI)
Weekly RSI(12) identifies bullish or bearish momentum.
Background turns green when RSI > 50 and monthly RS > 0, signaling a strong bullish environment.
Background turns red when RSI < 50, monthly RS < 0, and weekly RS(21) < 0, signaling weakness.
Weekly RS(21) Buy/Exit Signals
Buy Signal: Triggered when weekly RS(21) crosses above 0 while background is green, confirming momentum breakout.
Exit Signal: Triggered when weekly RS(21) crosses below 0 while background is green, signaling a reversal in momentum.
Trend & Volatility Tools
SMA 30: Displays the short-term trend for price alignment.
Bollinger Bands (20,2): Measures volatility and potential support/resistance zones.
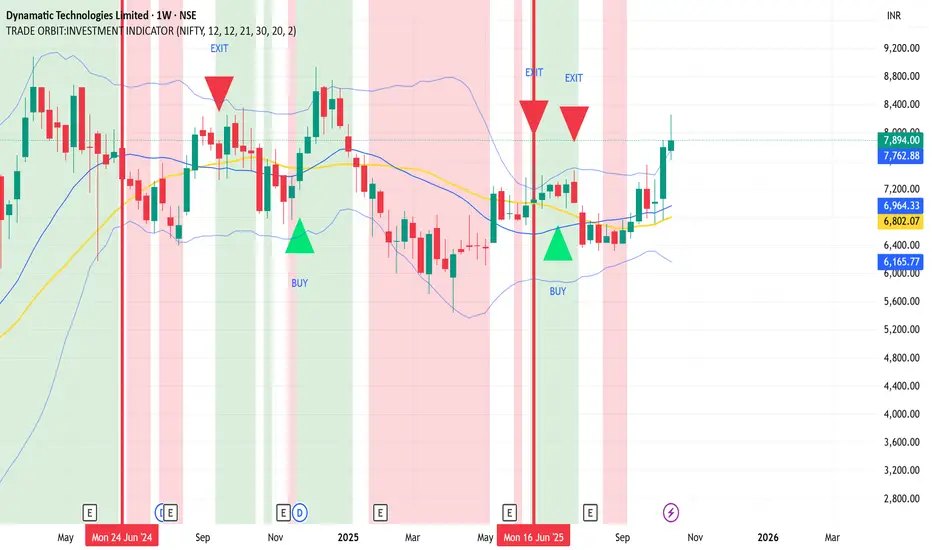
Visuals:
Green/Red semi-transparent backgrounds for bullish/bearish zones.
Buy signals marked with green upward triangles; Exit signals marked with red downward triangles.
SMA30 plotted in yellow; Bollinger Bands plotted in blue.
How to Use:
Entry: Look for green background + weekly RS(21) crossing above zero.
Exit: Close positions when weekly RS(21) crosses below zero.
Use SMA30 and Bollinger Bands to confirm trend and volatility alignment.
This indicator is perfect for traders who want a multi-timeframe strategy combining momentum, relative strength, and trend/volatility confirmation in a single chart overlay
Relative Strength vs NIFTY
Monthly RS(12): Measures how the symbol is performing relative to NIFTY over the past 12 months.
Positive RS indicates the symbol is outperforming the benchmark.
Momentum Filter (Weekly RSI)
Weekly RSI(12) identifies bullish or bearish momentum.
Background turns green when RSI > 50 and monthly RS > 0, signaling a strong bullish environment.
Background turns red when RSI < 50, monthly RS < 0, and weekly RS(21) < 0, signaling weakness.
Weekly RS(21) Buy/Exit Signals
Buy Signal: Triggered when weekly RS(21) crosses above 0 while background is green, confirming momentum breakout.
Exit Signal: Triggered when weekly RS(21) crosses below 0 while background is green, signaling a reversal in momentum.
Trend & Volatility Tools
SMA 30: Displays the short-term trend for price alignment.
Bollinger Bands (20,2): Measures volatility and potential support/resistance zones.
Visuals:
Green/Red semi-transparent backgrounds for bullish/bearish zones.
Buy signals marked with green upward triangles; Exit signals marked with red downward triangles.
SMA30 plotted in yellow; Bollinger Bands plotted in blue.
How to Use:
Entry: Look for green background + weekly RS(21) crossing above zero.
Exit: Close positions when weekly RS(21) crosses below zero.
Use SMA30 and Bollinger Bands to confirm trend and volatility alignment.
This indicator is perfect for traders who want a multi-timeframe strategy combining momentum, relative strength, and trend/volatility confirmation in a single chart overlay
Note di rilascio
Key Features:Relative Strength vs NIFTY
Monthly RS(12): Measures how the symbol is performing relative to NIFTY over the past 12 months.
Positive RS indicates the symbol is outperforming the benchmark.
Momentum Filter (Weekly RSI)
Weekly RSI(12) identifies bullish or bearish momentum.
Background turns green when RSI > 50 and monthly RS > 0, signaling a strong bullish environment.
Background turns red when RSI < 50, monthly RS < 0, and weekly RS(21) < 0, signaling weakness.
Weekly RS(21) Buy/Exit Signals
Buy Signal: Triggered when weekly RS(21) crosses above 0 while background is green, confirming momentum breakout.
Exit Signal: Triggered when weekly RS(21) crosses below 0 while background is green, signaling a reversal in momentum.
Trend & Volatility Tools
SMA 30: Displays the short-term trend for price alignment.
Bollinger Bands (20,2): Measures volatility and potential support/resistance zones.
Visuals:
Green/Red semi-transparent backgrounds for bullish/bearish zones.
Buy signals marked with green upward triangles; Exit signals marked with red downward triangles.
SMA30 plotted in yellow; Bollinger Bands plotted in blue.
How to Use:
Entry: Look for green background + weekly RS(21) crossing above zero.
Exit: Close positions when weekly RS(21) crosses below zero.
Use SMA30 and Bollinger Bands to confirm trend and volatility alignment.
This indicator is perfect for traders who want a multi-timeframe strategy combining momentum, relative strength, and trend/volatility confirmation in a single chart overlay
Script protetto
Questo script è pubblicato come codice protetto. Tuttavia, è possibile utilizzarlo liberamente e senza alcuna limitazione – per saperne di più clicca qui.
Declinazione di responsabilità
Le informazioni ed i contenuti pubblicati non costituiscono in alcun modo una sollecitazione ad investire o ad operare nei mercati finanziari. Non sono inoltre fornite o supportate da TradingView. Maggiori dettagli nelle Condizioni d'uso.