OPEN-SOURCE SCRIPT
Trend v4.0 Another update
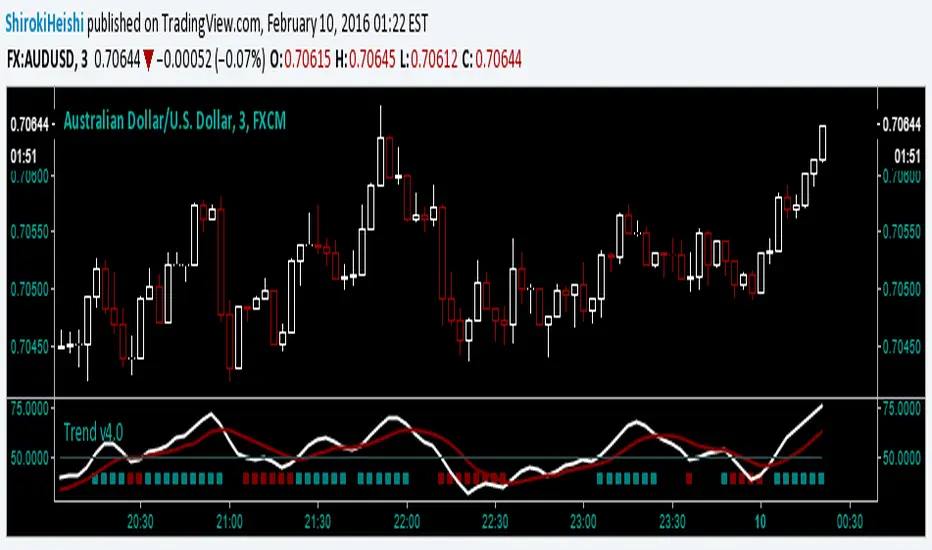
Yet another update, default settings can be customized to your needs. Be aware that while this is similar to the other versions, this can only repaint an active bar, but that slows it down by one period. You are warned. Be that as it may, the basic idea is the same; trying to capture the really strong moves into overbought or oversold territory as defined by Relative Strength index. In RSI mode, you can see the smoothing has slowed it down a bit, but warrants backtesting.
First green bar go long, First red bar go short, first white bar possible trend exhaustion. Or use crossovers and such, play with the inputs OB/OS, RSI length, signal length, tick length, swing length, as I said customize to your tastes. I offer no surety as to its efficacy, but we all learn.
Trade Responsibly,
Shiroki
Script open-source
In pieno spirito TradingView, il creatore di questo script lo ha reso open-source, in modo che i trader possano esaminarlo e verificarne la funzionalità. Complimenti all'autore! Sebbene sia possibile utilizzarlo gratuitamente, ricorda che la ripubblicazione del codice è soggetta al nostro Regolamento.
Declinazione di responsabilità
Le informazioni ed i contenuti pubblicati non costituiscono in alcun modo una sollecitazione ad investire o ad operare nei mercati finanziari. Non sono inoltre fornite o supportate da TradingView. Maggiori dettagli nelle Condizioni d'uso.