OPEN-SOURCE SCRIPT
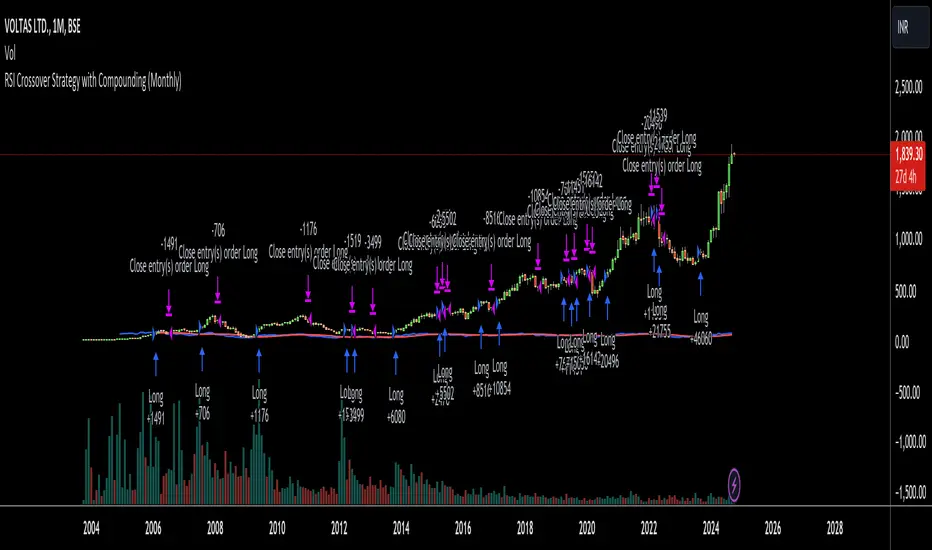
RSI Crossover Strategy with Compounding (Monthly)
Explanation of the Code:
Initial Setup:
The strategy initializes with a capital of 100,000.
Variables track the capital and the amount invested in the current trade.
RSI Calculation:
The RSI and its SMA are calculated on the monthly timeframe using request.security().
Entry and Exit Conditions:
Entry: A long position is initiated when the RSI is above its SMA and there’s no existing position. The quantity is based on available capital.
Exit: The position is closed when the RSI falls below its SMA. The capital is updated based on the net profit from the trade.
Capital Management:
After closing a trade, the capital is updated with the net profit plus the initial investment.
Plotting:
The RSI and its SMA are plotted for visualization on the chart.
A label displays the current capital.
Notes:
Test the strategy on different instruments and historical data to see how it performs.
Adjust parameters as needed for your specific trading preferences.
This script is a basic framework, and you might want to enhance it with risk management, stop-loss, or take-profit features as per your trading strategy.
Feel free to modify it further based on your needs!
Script open-source
Nello spirito di TradingView, l'autore di questo script lo ha reso open source, in modo che i trader possano esaminarne e verificarne la funzionalità. Complimenti all'autore! Sebbene sia possibile utilizzarlo gratuitamente, ricordiamo che la ripubblicazione del codice è soggetta al nostro Regolamento.
Declinazione di responsabilità
Le informazioni e le pubblicazioni non sono intese come, e non costituiscono, consulenza o raccomandazioni finanziarie, di investimento, di trading o di altro tipo fornite o approvate da TradingView. Per ulteriori informazioni, consultare i Termini di utilizzo.