OPEN-SOURCE SCRIPT
conditional_returns
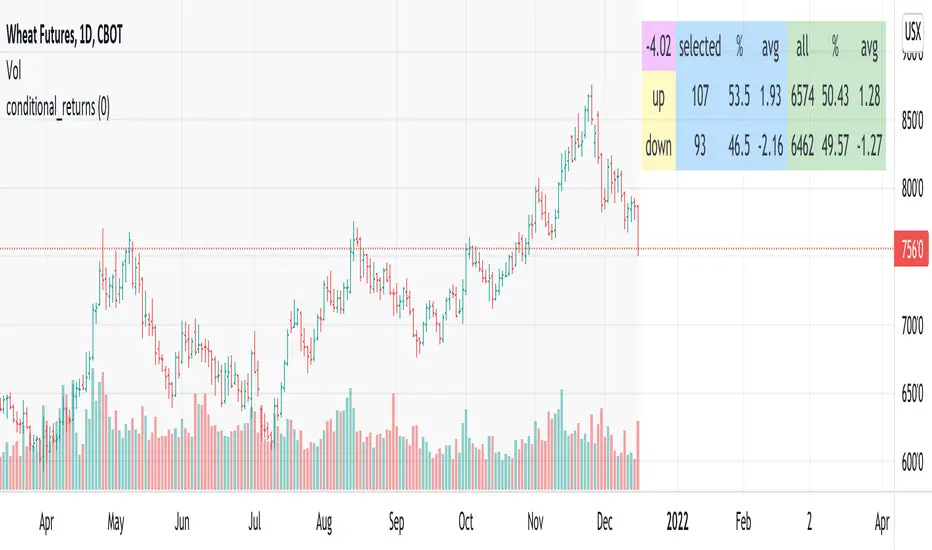
This script attempts to contextualize the instrument's latest return. It asks, "when a return of the same or greater magnitude occurred in the past, in the same direction, what was the following period's return?"
By default, the latest return is used. For example, on a daily chart, that would mean "today's" return. However, you can select any return you want using the "override" input.
The output table shows:
- The latest/override return, as a percentage. This is in the top left, fuchsia cell.
The first three, blue columns, show:
- The count of up and down (or positive and negative) next period returns. This shows you the sample size.
- The percentage of up/down next period returns.
- The average next-period return return, up and down, as percentages.
The next three, green columns show these same statistics, but for all returns--every period in the active date range is used. This data serves as a basis for comparison.
Note that you can select a custom date range with the "start" and "end" inputs. The corresponding area on the chart is shaded light grey, to show which data is used in the computations.
Script open-source
Nello spirito di TradingView, l'autore di questo script lo ha reso open source, in modo che i trader possano esaminarne e verificarne la funzionalità. Complimenti all'autore! Sebbene sia possibile utilizzarlo gratuitamente, ricordiamo che la ripubblicazione del codice è soggetta al nostro Regolamento.
Declinazione di responsabilità
Le informazioni e le pubblicazioni non sono intese come, e non costituiscono, consulenza o raccomandazioni finanziarie, di investimento, di trading o di altro tipo fornite o approvate da TradingView. Per ulteriori informazioni, consultare i Termini di utilizzo.