PROTECTED SOURCE SCRIPT
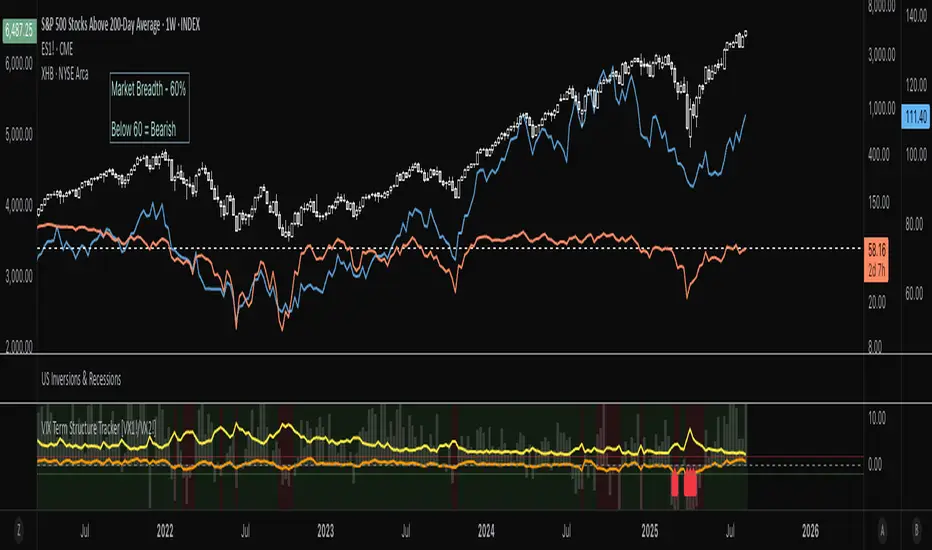
VIX Term Structure Tracker [VX1!/VX2!]
1. Data Preparation
The script starts by fetching four key data series on a daily ("D") timeframe:
VIX (CBOE:VIX): The spot VIX index, a real-time measure of market expectations of future volatility.
VX1! (CBOE:VX1!): The price of the front-month (nearest to expiration) VIX futures contract.
VX2! (CBOE:VX2!): The price of the next-month VIX futures contract.
SPX (SP:SPX): The S&P 500 Index, which serves as a benchmark for the overall market.
2. Term Structure and Market Psychology
The core of the indicator lies in analyzing the relationship between the futures prices.
term_slope = vx2 - vx1: This calculates the difference between the next-month and front-month VIX futures prices.
Contango: If vx2 > vx1, the slope is positive, and the market is in contango. This is the "normal" state, where traders expect volatility to be lower in the future. The script colors this background a light green.
Backwardation: If vx2 < vx1, the slope is negative, and the market is in backwardation. This is a rare state indicating elevated fear. It means traders are willing to pay a premium for short-term protection against volatility, implying that an increase in fear is imminent. The script colors this background a light red.
3. Roll Yield Calculation
roll_yield = ((vx1 - vix) / days_to_expiry) * 100: This calculates the estimated return (or loss) from rolling a futures position from the spot VIX to the front-month future. This is a key metric for understanding the cost of holding VIX futures. A negative roll yield means it is expensive to hold a long VIX position.
4. Equilibrium and Z-Score
This section of the code provides a statistical measure to determine how extreme the current term structure is compared to its historical average.
avg_slope = ta.sma(term_slope, 252): This calculates the one-year simple moving average of the term structure slope.
z_score: This is the most powerful part of the indicator. It measures how many standard deviations the current term_slope is from its one-year average.
A Z-score of +2 or higher indicates the market is in an extreme state of contango (complacency), where volatility is abnormally low.
A Z-score of -2 or lower indicates an extreme state of backwardation (fear), where there's an abnormal surge in short-term volatility expectations.
5. Visualizations & Signals
The script presents a comprehensive view of these metrics on the chart.
plot(term_slope): Shows a blue line representing the VIX term structure slope.
bgcolor(...): Visually highlights periods of contango (light green) and backwardation (light red).
plot(roll_yield): Displays a column chart showing the roll yield, indicating the cost or benefit of holding VIX futures.
plot(z_score): Shows an orange line representing the Z-score, with horizontal lines at +2 and -2 to highlight extreme conditions.
plotshape(...): These are your trading signals. A red arrow pointing up (shape.labelup) appears at the bottom of the chart when the Z-score drops below -2 (extreme backwardation), and a green arrow pointing down (shape.labeldown) appears at the top when the Z-score goes above +2 (extreme contango).
6. Interpretation and Trading Signals
The script provides a clear framework for interpreting market sentiment:
Extreme Backwardation Signal (Red Arrow Up): When the Z-score falls to -2 or below, it signals a period of extreme market fear. This is often an excellent contrarian signal for buying the VIX (or related products) and/or for caution in long equity positions.
Extreme Contango Signal (Green Arrow Down): When the Z-score rises to +2 or above, it signals a period of extreme market complacency. This can be a contrarian signal for selling the VIX (or related products) and/or for potential short-term weakness in the S&P 500.
The VIX/SPX Risk Ratio also provides a good visual of volatility relative to the S&P 500, with an increasing ratio signaling a rising risk environment.
Ultimately, this indicator provides a powerful way to visualize the VIX futures term structure and use statistical analysis (Z-score) to find high-probability signals of extreme market sentiment.
Script protetto
Questo script è pubblicato come codice protetto. Tuttavia, è possibile utilizzarle liberamente e senza alcuna limitazione – ulteriori informazioni qui.
Declinazione di responsabilità
Le informazioni e le pubblicazioni non sono intese come, e non costituiscono, consulenza o raccomandazioni finanziarie, di investimento, di trading o di altro tipo fornite o approvate da TradingView. Per ulteriori informazioni, consultare i Termini di utilizzo.