Option Range Projector PRO (with Alerts)
Short Description
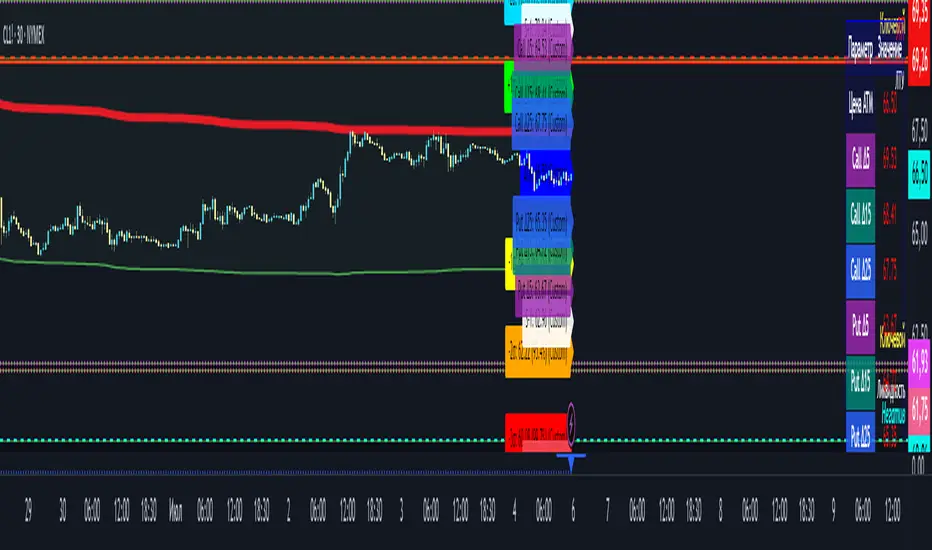
This is a powerful and flexible tool for traders that visualizes expected price movement ranges based on option pricing principles and statistical deviations. The indicator plots standard deviation levels (Sigmas) and boundaries calculated from the price of an options Straddle, providing a unique insight into market volatility expectations.
It is ideal for options traders, as well as those who trade futures or spot assets and want to gain an edge by understanding where the market anticipates price boundaries on a specific date.
Core Concepts
The indicator is based on three key ideas:
Standard Deviation (Sigma, σ): In statistics, this is a measure of value dispersion. In trading, when applied to prices, standard deviation levels show the probable range within which the price is expected to remain until a specific date (expiration).
±1σ (1 Sigma): Approximately 68.2% probability that the price will stay within this range.
±2σ (2 Sigmas): Approximately 95.4% probability. These levels often act as strong support/resistance.
±3σ (3 Sigmas): Approximately 99.7% probability. Reaching these levels is a statistically rare event.
Implied Volatility (IV): This is a key component. IV is the market's forecast of the asset's future volatility. It is derived from current option prices and reflects how significant the price movements are expected to be by traders. The higher the IV, the wider the calculated ranges will be.
Straddle-Based Levels: A straddle is an options strategy involving the simultaneous purchase of a Call and a Put option with the same strike price and expiration date. The cost of this combination (Call + Put) directly reflects the market's expected price movement in points. Our indicator uses this value to construct alternative, highly accurate boundaries of the expected range.
Key Features
Flexible Expiration Choice: Easily switch between standard contracts (Weekly, Monthly, Quarterly) or set any custom number of days to expiration (DTE).
Dual Volatility Calculation Mode: Use automatic calculation based on historical data or enter a precise IV value manually (e.g., from your broker's terminal) for maximum accuracy.
Two Types of Predictive Levels: Visualize classic standard deviations (Sigmas) and/or levels calculated from the Straddle price for a comprehensive analysis.
Expiration Comparison: Enable the display of additional levels for a different expiration date to visually compare short-term and long-term market expectations.
"Greeks" Calculation: The indicator calculates and displays key option Greeks (Delta, Gamma, Theta, Vega), helping to deepen the understanding of an option position's characteristics.
Informative Table: All key data—ATM price, IV, DTE, level prices, Greeks, and option prices—are consolidated into one clear table for quick analysis.
Customizable Alerts: Get instant notifications directly in TradingView when the price crosses any of the important levels (±1σ, ±2σ, ±3σ).
Full Visual Customization: Control colors, line thickness, labels, and zone fills to adapt the indicator to your trading style.
How to Use (Settings)
Price Settings:
Auto-detect ATM Price: When enabled, the indicator will use the current closing price as the At-The-Money (ATM) price.
Manual ATM Price: If auto mode is disabled, you can set a precise ATM price manually.
Volatility Settings:
Auto-calculate IV: Calculates historical volatility over a specified period. Useful if you don't have access to real-time IV.
Manual IV Value: (Recommended for accuracy). Enter the Implied Volatility (IV) value for the desired strike from your brokerage terminal or analytical services here.
Expiration:
Contract Type: Choose one of the standard terms (Weekly, Monthly, Quarterly) or "Custom" to use a manual day input.
Days to Expiration: Active only for the "Custom" type.
Show Multiple Expirations: Enables a second set of levels with a different term for comparison.
Straddle Boundaries:
Use Manual Input: Allows you to enter the precise Call and Put Settle prices from the official exchange summary (e.g., from the CME website). This provides the most accurate boundaries based on real market prices.
Trading Ideas and Application
Mean Reversion Trading: The ±2σ and ±3σ levels often act as strong overbought/oversold zones. A price reaching these extreme values has a high statistical probability of reversing or correcting back towards the central ATM price.
Trend Confirmation and Breakouts: A confident close outside the ±1σ range can indicate the beginning of a strong directional move.
Risk Management: Use the levels to set stop-losses or determine profit targets. For example, when opening a trade near the +1σ level, you might consider a target at +2σ and place a stop-loss behind the ATM level.
Volatility Analysis: By comparing the width of the ranges for different expirations, you can assess how the market is pricing short-term versus long-term risks. A narrow range suggests low expectations, while a wide range indicates high ones.
Disclaimer: This indicator is an analysis tool and does not provide direct financial advice or trading signals. All trading decisions are your own. Use this indicator in conjunction with other analysis methods.
- Moved manual input fields for `manualDelta`, `manualGamma`, `manualVega`, and `manualTheta` from the `greeksGroup` to the `straddleGroup`, making them available specifically when `useManualStraddle` and `straddleCalcMethod` is set to "With Greeks".
- Updated the `greeksGroup` to be empty, with a tooltip indicating that Greek values are now managed within the straddle settings.
- Modified the `straddleCalcMethod` tooltip to reflect the use of all four Greeks (Delta, Gamma, Vega, Theta) for the "With Greeks" option.
- Enhanced the straddle calculation logic:
- When `useManualStraddle` is true, `straddlePrice` is calculated as `manualCallSettle + manualPutSettle`.
- For `straddleCalcMethod` set to `"Call+Put"`, it uses the standard `atmPrice ± straddlePrice` for level calculations.
- For `straddleCalcMethod` set to `"With Greeks"`, it applies a comprehensive adjustment using manual Greek values:
- `deltaAdjustment = delta * (atmPrice * 0.01)` (1% change in underlying price).
- `vegaAdjustment = vega * (manualIv * 0.01)` (1% change in implied volatility).
- `gammaAdjustment = gamma * math.pow(atmPrice * 0.01, 2) / 2` (second-order price sensitivity).
- `thetaAdjustment = theta * (1 / 365.0)` (daily time decay, assuming 365 days per year).
- `adjustedAtmPrice = atmPrice + deltaAdjustment + vegaAdjustment + gammaAdjustment + thetaAdjustment`, which is then used to calculate `straddlePlus1`, `straddleMinus1`, etc.
- Kept the table settings with `showTableGreeks` as `false` to exclude Greeks from display.
- No changes were made to plotting, labels, filling, or alerts, as they remain unaffected by this update.
The latest update to the Option Range Projector PRO script enhances its functionality by introducing advanced features for calculating Delta levels and offering flexible methods for computing Sigma and Delta. These additions provide traders with greater precision and customization when analyzing option price levels and market expectations on TradingView.
New Features
1. Delta Level Calculations (5%, 15%, and 25%)
The update introduces the ability to calculate strike prices corresponding to 5%, 15%, and 25% Delta levels for both Call and Put options. This feature allows traders to identify key out-of-the-money (OTM) strike prices based on the option's Delta, which measures the sensitivity of an option’s price to changes in the underlying asset’s price.
Purpose: These Delta levels are critical for options traders as they represent the probability of an option expiring in-the-money. For example:
5% Delta: Represents far OTM options with a low probability (~5%) of expiring in-the-money.
15% Delta: Represents moderately OTM options.
25% Delta: Represents closer-to-the-money options, often used in strategies like straddles or strangles.
Implementation: The script uses the Black-Scholes model to compute strike prices by solving for the strike where the Delta matches the target values (0.05, 0.15, and 0.25). The calculation accounts for implied volatility, time to expiry, and the risk-free rate.
Display:
Delta levels are plotted on the chart with customizable colors (delta5Color, delta15Color, delta25Color) and optional labels (showDeltaLabels).
They are also included in the information table (showTableDeltaLevels) for quick reference.
Benefit: Traders can visualize and analyze key strike levels for risk management, option selection, or strategy planning, such as delta-neutral trading or hedging.
2. Linear and Exponential Calculation Methods for Sigma and Delta
The script now supports two methods for calculating Standard Deviation (Sigma) levels and Delta-based strike prices: Linear and Exponential. This allows users to choose the model that best aligns with their market assumptions and trading style.
Linear Method:
Sigma Calculation: Assumes a straightforward linear relationship between volatility and price movements. The formula uses the daily volatility scaled by the square root of time to expiry.
Delta Calculation: Approximates strike prices for target Delta values using a linear scaling of volatility and time, providing a simpler and more predictable output.
Use Case: Suitable for markets with stable volatility or when simplicity is preferred for quick analysis.
Exponential Method:
Sigma Calculation: Accounts for the exponential nature of price movements, using a logarithmic approach to model volatility.
Delta Calculation: Uses a more complex iterative approach to find strike prices, incorporating the non-linear effects of volatility and time decay for greater accuracy in volatile markets.
Use Case: Ideal for markets with high volatility or when modeling longer-term expirations where exponential effects are more pronounced.
Implementation:
Users can select the calculation method via the calcMethod (for Sigma) and deltaCalcMethod (for Delta) inputs, with options set to either "Linear" or "Exponential".
The script ensures accurate calculations by validating inputs (e.g., positive days to expiry, non-zero volatility) and handling edge cases with fallback values.
Benefit: This dual-method approach provides flexibility to adapt to different market conditions, allowing traders to choose between simpler linear projections or more sophisticated exponential models based on their analysis needs.
User Interface Enhancements
Input Settings:
New input options under "Настройки расчета Стандартных отклонений и Дельты" (Standard Deviation and Delta Calculation Settings) allow users to toggle between Linear and Exponential methods.
Delta-related inputs are integrated into the existing interface, maintaining a clean and organized user experience.
Visual Customization:
Delta levels are displayed with distinct colors for easy identification (e.g., purple for 5% Delta, teal for 15% Delta, blue for 25% Delta).
Labels for Delta levels can be enabled/disabled (showDeltaLabels) and are formatted to include the contract type and price with user-defined decimal precision.
Table Integration:
The information table now includes Delta strike prices (Call and Put Δ5, Δ15, Δ25) when showTableDeltaLevels is enabled, ensuring all relevant data is accessible in one place.
Technical Details
Delta Calculation:
The findStrikeByDelta function uses an iterative Newton-Raphson method to solve for the strike price corresponding to a target Delta. It ensures convergence with a maximum of 200 iterations and a tolerance of 0.0001 for precision.
The function accounts for whether the option is a Call or Put and enforces constraints to prevent invalid strike prices (e.g., Call strikes below ATM or Put strikes above ATM).
Sigma Calculation:
Both Linear and Exponential methods use the Black-Scholes framework for consistency, with the Exponential method incorporating the logarithmic impact of volatility over time.
Performance:
Optimized to handle up to 500 lines and labels (max_lines_count=500, max_labels_count=500) for smooth rendering on TradingView.
Input validation prevents runtime errors, such as negative days to expiry or zero volatility.
Benefits for Traders
Enhanced Decision-Making: Delta levels provide actionable insights into option pricing and probability, enabling better trade selection and risk assessment.
Customizable Analysis: The choice between Linear and Exponential methods allows traders to tailor the script to their market outlook, whether they prioritize simplicity or precision.
Comprehensive Visualization: The combination of chart plots, labels, and a detailed information table ensures all critical data is readily available for quick analysis.
Conclusion
The updated Option Range Projector PRO script significantly enhances its utility for options traders by adding Delta level calculations and flexible Sigma/Delta computation methods. These features empower users to analyze market expectations with greater accuracy and adapt the tool to various trading strategies and market conditions.
In the last block provided, the following change was made to the daysToExpiry input within the "Expiration Settings" (expGroup) section:
Modified the daysToExpiry input from input.int(1, ...) to input.float(1.0, ..., minval = 0.01, step = 0.01) to allow decimal values with up to two decimal places.
The step = 0.01 parameter ensures input increments of 0.01, enabling precise decimal inputs.
The minval = 0.01 parameter ensures the input value is positive and not less than 0.01.
Updated the tooltip to clarify that decimal values up to two places can be entered.
No other changes were made to the block, preserving all other settings and parameters as in the original script.
Script su invito
Solo gli utenti approvati dall'autore possono accedere a questo script. È necessario richiedere e ottenere l'autorizzazione per utilizzarlo. Tale autorizzazione viene solitamente concessa dopo il pagamento. Per ulteriori dettagli, seguire le istruzioni dell'autore riportate di seguito o contattare direttamente VitaliyBer.
TradingView NON consiglia di acquistare o utilizzare uno script a meno che non si abbia piena fiducia nel suo autore e se ne comprenda il funzionamento. È inoltre possibile trovare alternative gratuite e open source nei nostri script della community.
Istruzioni dell'autore
Declinazione di responsabilità
Script su invito
Solo gli utenti approvati dall'autore possono accedere a questo script. È necessario richiedere e ottenere l'autorizzazione per utilizzarlo. Tale autorizzazione viene solitamente concessa dopo il pagamento. Per ulteriori dettagli, seguire le istruzioni dell'autore riportate di seguito o contattare direttamente VitaliyBer.
TradingView NON consiglia di acquistare o utilizzare uno script a meno che non si abbia piena fiducia nel suo autore e se ne comprenda il funzionamento. È inoltre possibile trovare alternative gratuite e open source nei nostri script della community.