Demand Supply Screener 1.0
The more the number of symbols or smaller the time frame, the longer it will take for the screener to shortlist symbols. This can result in a calculation timeout. In such a case, you can reduce the number of symbols in the list by splitting it into multiple charts/indicators until the error is resolved.
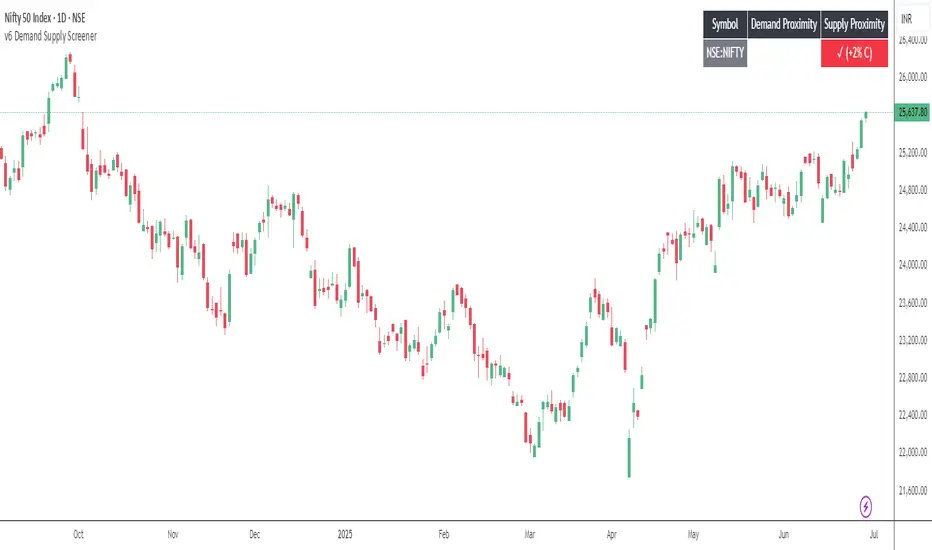
Use "Proximity %" to filter symbols, for example, if you set it to 2%, the screener will shortlist symbols where the high/low of the time frame you are on is within 2% proximity of the supply/demand zone respectively.
For shortlisting symbols that are currently touching demand supply zones or trading inside of them use Proximity % as 0 and ensure Show Tested Zones is enabled.
The Demand Supply Screener is a powerful tool designed to help traders quickly identify the best demand and supply zone opportunities across multiple symbols, all in one place. It uses advanced zone detection logic inspired by institutional trading methods to highlight where strong buying (demand) or selling (supply) imbalances exist, allowing you to focus only on high-probability setups. The screener helps you identify symbols that are trading close to or inside demand and supply zones, so you can quickly spot potential opportunities without manual chart scanning.
Key Features
Multi-Symbol Screening
Analyze up to 15 symbols simultaneously. Monitor major indices, forex pairs, commodities, or stocks at the same time without switching charts.
Advanced Pattern Detection
Detects strong demand and supply zones using patterns such as Gap, Regular, and Follow-Through. Focus on the setups that matter most.
Dynamic Table Display
Cleanly displays symbol names, pattern details, and proximity data directly on your chart in a table format. Stay organized and make faster decisions.
Customizable Filtering
Choose which pattern types to include, set proximity thresholds, and filter symbols based on your strategy needs.
When the price is outside a zone:
• For demand zones, if the zone is below the current closing price, the distance will be shown as a negative percentage. This indicates the price needs to move down by that percentage to reach the demand zone proximal line.
• For supply zones, if the zone is above the current price, the distance will be shown as a positive percentage, showing how much the price needs to move up to reach the supply zone.
When the price is already inside a zone:
• For demand zones, the distance is shown as a positive percentage, indicating how much the price must move up to exit the zone.
• For supply zones, the distance is shown as a negative percentage, indicating how much the price needs to drop to leave the zone.
This update provides a clearer and more intuitive view of how far the price is from each zone or how much it needs to move to exit a zone if already inside.
Now, along with the percentage proximity to the zone, the screener also indicates whether the current price is INSIDE or OUTSIDE the zone:
- IN → Price is within the demand or supply zone
- OUT → Price is outside the zone
This helps you make quicker, more informed trading decisions at a glance.
Script su invito
Solo gli utenti approvati dall'autore possono accedere a questo script. È necessario richiedere e ottenere l'autorizzazione per utilizzarlo. Tale autorizzazione viene solitamente concessa dopo il pagamento. Per ulteriori dettagli, seguire le istruzioni dell'autore riportate di seguito o contattare direttamente SurjeetKakkar.
TradingView NON consiglia di acquistare o utilizzare uno script a meno che non si abbia piena fiducia nel suo autore e se ne comprenda il funzionamento. È inoltre possibile trovare alternative gratuite e open source nei nostri script della community.
Istruzioni dell'autore
Declinazione di responsabilità
Script su invito
Solo gli utenti approvati dall'autore possono accedere a questo script. È necessario richiedere e ottenere l'autorizzazione per utilizzarlo. Tale autorizzazione viene solitamente concessa dopo il pagamento. Per ulteriori dettagli, seguire le istruzioni dell'autore riportate di seguito o contattare direttamente SurjeetKakkar.
TradingView NON consiglia di acquistare o utilizzare uno script a meno che non si abbia piena fiducia nel suo autore e se ne comprenda il funzionamento. È inoltre possibile trovare alternative gratuite e open source nei nostri script della community.