OPEN-SOURCE SCRIPT
Aggiornato Linear Regression Channel / Curve / Slope by DGT
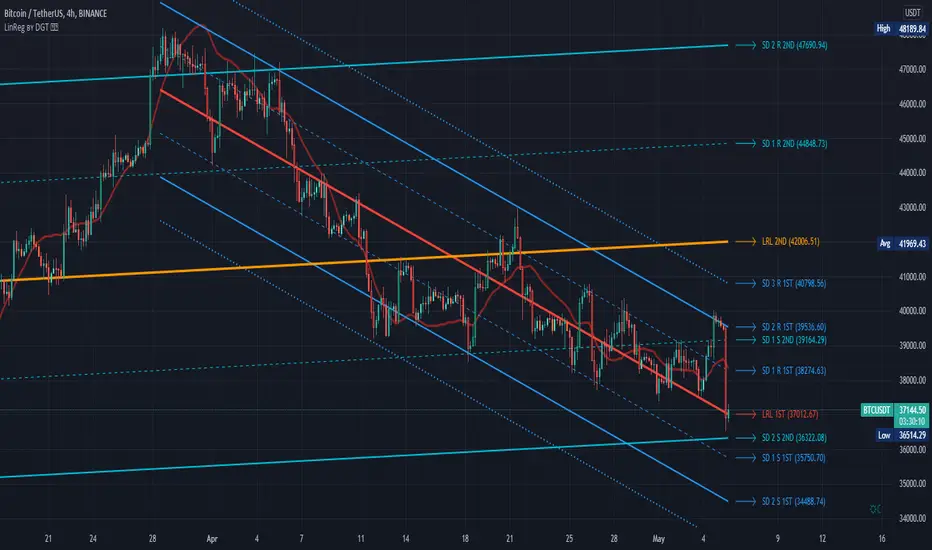
Tʜᴇ Lɪɴᴇᴀʀ Rᴇɢʀᴇꜱꜱɪᴏɴ Cʜᴀɴɴᴇʟꜱ
Linear Regression Channels are useful measure for technical and quantitative analysis in financial markets that help identifying trends and trend direction. The use of standard deviation gives traders ideas as to when prices are becoming overbought or oversold relative to the long term trend
The basis of a linear regression channel
Linear Regression Line – is a line drawn according to the least-squares statistical technique which produces a best-fit line that cuts through the middle of price action, a line that best fits all the data points of interest. The resulting fitted model can be used to summarize the data, to predict unobserved values from the same system. Linear Regression Line then present basis for the channel calculations

The linear regression channel
2. Upper Channel Line – A line that runs parallel to the Linear Regression Line and is usually one to two standard deviations above the Linear Regression Line.
3. Lower Channel Line – This line runs parallel to the Linear Regression Line and is usually one to two standard deviations below the Linear Regression Line.
Unlike Fibonacci Channels and Andrew’s Pitchfork, Linear Regression Channels are calculated using statistical methods, both for the regression line (as expressed above) and deviation channels. Upper and Lower channel lines are presenting the idea of bell curve method, also known as a normal distribution and are calculated using standard deviation function.
A standard deviation include 68% of the data points, two standard deviations include approximately 95% of the data points and any data point that appears outside two standard deviations is very rare.
It is often assumed that the data points will move back toward the average, or regress and channels would allow us to see when a security is overbought or oversold and ready to revert to the mean

please note : Over time, the price will move up and down, and the linear regression channel will experience changes as old prices fall off and new prices appear
█ Linear Regression Study Features
Linear Regression Channel
- Linear regression line as basis
- Customizable multiple channels based on Standard Deviation
- ALERTs for the channel levels

Linear Regression Curve
- Linear regression curve as basis
- Optional : Bands based on Standard Deviation or Volatility (ATR). Bands are applied with fixed levels 1, 2 and 3 times StdDev or ATR away from the curve

Linear Regression Slope
- Optional : Up/Down slope arrows for a used defined period

█ Volume / Volatility Add-Ons
High Volatile Bar Indication
Volume Spike Bar Indication
Volume Weighted Colored Bars

Linear Regression Channels are useful measure for technical and quantitative analysis in financial markets that help identifying trends and trend direction. The use of standard deviation gives traders ideas as to when prices are becoming overbought or oversold relative to the long term trend
The basis of a linear regression channel
Linear Regression Line – is a line drawn according to the least-squares statistical technique which produces a best-fit line that cuts through the middle of price action, a line that best fits all the data points of interest. The resulting fitted model can be used to summarize the data, to predict unobserved values from the same system. Linear Regression Line then present basis for the channel calculations
The linear regression channel
2. Upper Channel Line – A line that runs parallel to the Linear Regression Line and is usually one to two standard deviations above the Linear Regression Line.
3. Lower Channel Line – This line runs parallel to the Linear Regression Line and is usually one to two standard deviations below the Linear Regression Line.
Unlike Fibonacci Channels and Andrew’s Pitchfork, Linear Regression Channels are calculated using statistical methods, both for the regression line (as expressed above) and deviation channels. Upper and Lower channel lines are presenting the idea of bell curve method, also known as a normal distribution and are calculated using standard deviation function.
A standard deviation include 68% of the data points, two standard deviations include approximately 95% of the data points and any data point that appears outside two standard deviations is very rare.
It is often assumed that the data points will move back toward the average, or regress and channels would allow us to see when a security is overbought or oversold and ready to revert to the mean
please note : Over time, the price will move up and down, and the linear regression channel will experience changes as old prices fall off and new prices appear
█ Linear Regression Study Features
Linear Regression Channel
- Linear regression line as basis
- Customizable multiple channels based on Standard Deviation
- ALERTs for the channel levels
Linear Regression Curve
- Linear regression curve as basis
- Optional : Bands based on Standard Deviation or Volatility (ATR). Bands are applied with fixed levels 1, 2 and 3 times StdDev or ATR away from the curve
Linear Regression Slope
- Optional : Up/Down slope arrows for a used defined period
█ Volume / Volatility Add-Ons
High Volatile Bar Indication
Volume Spike Bar Indication
Volume Weighted Colored Bars
Note di rilascio
default slope input length value reducedDisclaimer:
Trading success is all about following your trading strategy and the indicators should fit within your trading strategy, and not to be traded upon solely
The script is for informational and educational purposes only. Use of the script does not constitute professional and/or financial advice. You alone have the sole responsibility of evaluating the script output and risks associated with the use of the script. In exchange for using the script, you agree not to hold dgtrd TradingView user liable for any possible claim for damages arising from any decision you make based on use of the script
Note di rilascio
added ability to plot second Linear Regression ChannelDefault lookback period (count) of Linear Regression Channel values are set as
1st Channel - 200
2nd Channel - 50
Note di rilascio
updateadded ability to plot higher time frame ("1D",, "4H", and "1H") linear regression channel on intraday bar. option is available with the second linear regression channel, please check details in the tooltip option with usage info
ability to set period to maximum allowed lenght (5000)
Note di rilascio
update* enhanced label customization options
* alert additions, First Linear Regression Median Line versus Second Linear Regression Median and Deviation Line crosses
* Pine v5
Script open-source
In pieno spirito TradingView, il creatore di questo script lo ha reso open-source, in modo che i trader possano esaminarlo e verificarne la funzionalità. Complimenti all'autore! Sebbene sia possibile utilizzarlo gratuitamente, ricorda che la ripubblicazione del codice è soggetta al nostro Regolamento.
Our Premium Indicators: sites.google.com/view/solemare-analytics
Declinazione di responsabilità
Le informazioni ed i contenuti pubblicati non costituiscono in alcun modo una sollecitazione ad investire o ad operare nei mercati finanziari. Non sono inoltre fornite o supportate da TradingView. Maggiori dettagli nelle Condizioni d'uso.