PROTECTED SOURCE SCRIPT
SmartFib Pro [By TraderMan]
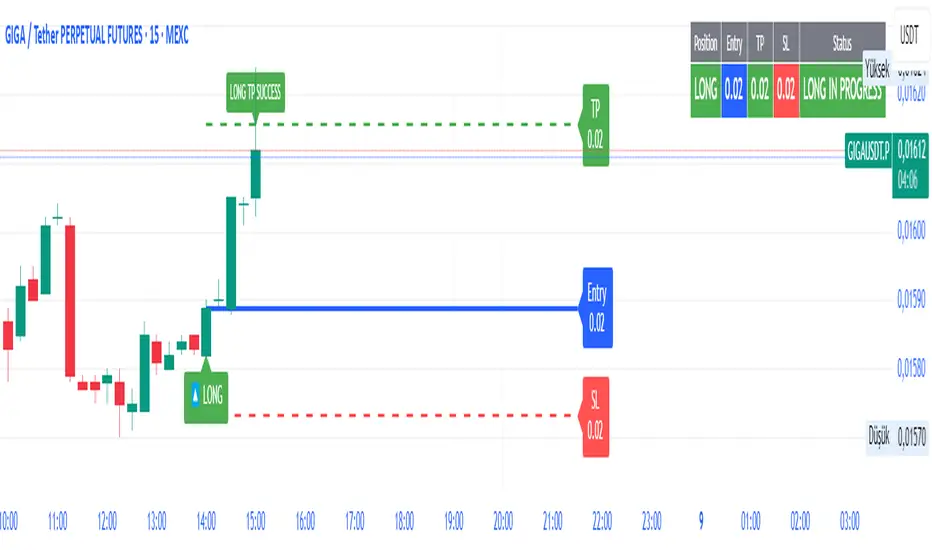
📊 SmartFib Pro — Smart Fibonacci Support & Resistance + TP/SL + Live Position Tracking
🚀 With SmartFib Pro [By TraderMan], automatically track Fibonacci support and resistance levels on your chart!
This indicator dynamically shows long/short entry points, TP (Take Profit), and SL (Stop Loss) levels based on price movements, with easy-to-read lines. You can also monitor your position status live via a table at the top-right of your screen.
⚙️ How It Works?
📈 When price breaks key Fibonacci levels (especially 78.6% and 23.6%), the indicator automatically generates long or short signals.
Entry lines are drawn in blue, TP lines in green, and SL lines in red.
Entry, TP, and SL levels are displayed as labels next to the lines.
Active position lines and labels remain on the chart while the position is open, and past position lines are cleared automatically.
When TP or SL is hit, the indicator instantly notifies on the chart and in the table with “TP SUCCESSFUL” or “STOP HIT.”
🛠️ How to Use?
Add the indicator to your chart.
Adjust Fibonacci high and low lengths (default 50 bars) and line length (default 50 bars) from the inputs.
Long signals are generated when price breaks above the 78.6% level; short signals occur when price breaks below the 23.6% level.
TP is automatically set 3.5% away from the entry line, SL is set 1.5% away.
Follow the blue (entry), green (TP), and red (SL) lines and their labels on the chart.
Monitor your position info live in the top-right table.
When TP or SL triggers, position closes, and lines/labels are cleared for the next signal.
💡 Why SmartFib Pro?
✅ Automated position entry and exit strategy based on Fibonacci levels
✅ Live position tracking and status updates to help your trading decisions
✅ Clear, colorful, and minimalistic chart visuals eliminate clutter
✅ Ideal for both beginners and pros, providing fast and reliable signals
📣 Important Notes:
This indicator generates signals but always use proper risk management according to market conditions!
You can adjust TP/SL percentages to fit your own risk tolerance.
Always support signals with your own analysis.
💬 Catch the trend, manage your risk, and grow your profits with SmartFib Pro!
📈🔵🟢🔴
Script protetto
Questo script è pubblicato come codice protetto. Tuttavia, è possibile utilizzarle liberamente e senza alcuna limitazione – ulteriori informazioni qui.
Declinazione di responsabilità
Le informazioni e le pubblicazioni non sono intese come, e non costituiscono, consulenza o raccomandazioni finanziarie, di investimento, di trading o di altro tipo fornite o approvate da TradingView. Per ulteriori informazioni, consultare i Termini di utilizzo.