OPEN-SOURCE SCRIPT
Aggiornato Hosoda N Wave and TPs {fmz}
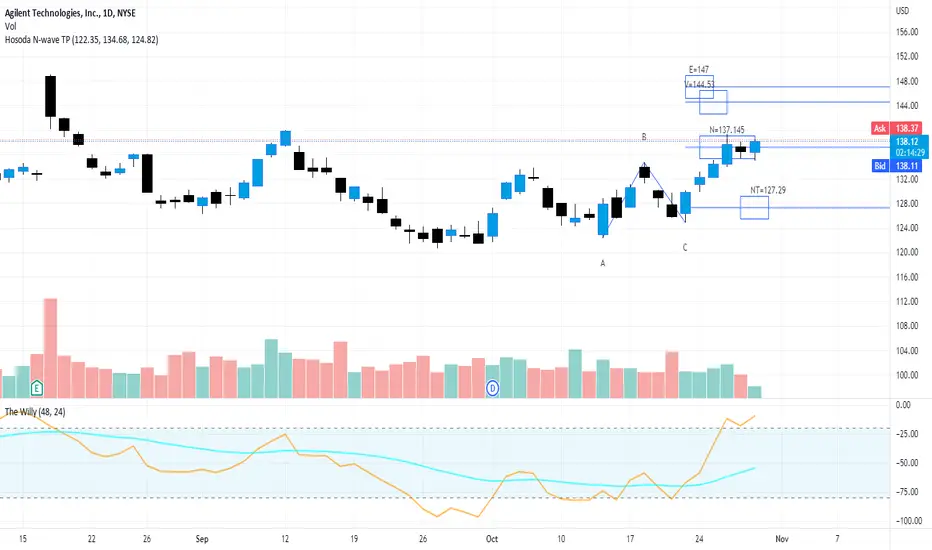
This script allows you to establish in a graphic and interactive way which are the N, NT, V and E targets for a Hosoda N wave.
Apply the indicator to the chart.
The interactive tool of Pine script version 5 will ask you to identify three points of "minimum-maximum-higher minimum" that form a bullish N wave of Hosoda (refer to the specific documentation for Hosoda N wave), or on the contrary three points "maximum-minimum-lower maximum" for a bearish N wave.
Once drawn, the price points can be moved.
When changing the market instrument, the indicator must be removed because it remains linked to the prices where it was first drawn.
Note di rilascio
Thank to all guys that asked me to improve this script adding the time part of the theory.This new version allows from the moment in which the selected points ABC of the N wave are plotted to estimate where the objectives will be reached according to the Hosoda theory both in price and in time.
For the details of the calculation, see the references relating to the Nosoda N wave.
To use it you need to add it to the chart, the chart will ask you to choose three points (minimum-maximum minimum greater for a bullish trend, or maximum-minimum-maximum lower for a bearish trend) from which it will derive the possible targets for Hosoda.
Please check if it works well and report me in the comments if there are any problems, describing in detail the environment in which you are trying it in case you want to make reports.
Note di rilascio
Restored lines on target with boolean to hide and show themNote di rilascio
Conditional hide of Tp E date-time if BC>AC, the time target will be before point C. I'm curious about timing rule for choosing ABC point in Hosoda books, Anyone knows? Maybe we ave a AB time smaller than BC? So E target timing will be before C? Note di rilascio
Allows to create a grid on time and price targets. Allows to trim horizontal lines to limit chart cluttering.Script open-source
In pieno spirito TradingView, il creatore di questo script lo ha reso open-source, in modo che i trader possano esaminarlo e verificarne la funzionalità. Complimenti all'autore! Sebbene sia possibile utilizzarlo gratuitamente, ricorda che la ripubblicazione del codice è soggetta al nostro Regolamento.
Declinazione di responsabilità
Le informazioni ed i contenuti pubblicati non costituiscono in alcun modo una sollecitazione ad investire o ad operare nei mercati finanziari. Non sono inoltre fornite o supportate da TradingView. Maggiori dettagli nelle Condizioni d'uso.
Script open-source
In pieno spirito TradingView, il creatore di questo script lo ha reso open-source, in modo che i trader possano esaminarlo e verificarne la funzionalità. Complimenti all'autore! Sebbene sia possibile utilizzarlo gratuitamente, ricorda che la ripubblicazione del codice è soggetta al nostro Regolamento.
Declinazione di responsabilità
Le informazioni ed i contenuti pubblicati non costituiscono in alcun modo una sollecitazione ad investire o ad operare nei mercati finanziari. Non sono inoltre fornite o supportate da TradingView. Maggiori dettagli nelle Condizioni d'uso.