OPEN-SOURCE SCRIPT
BB - MFI/RSI [Modified from LazyBear]
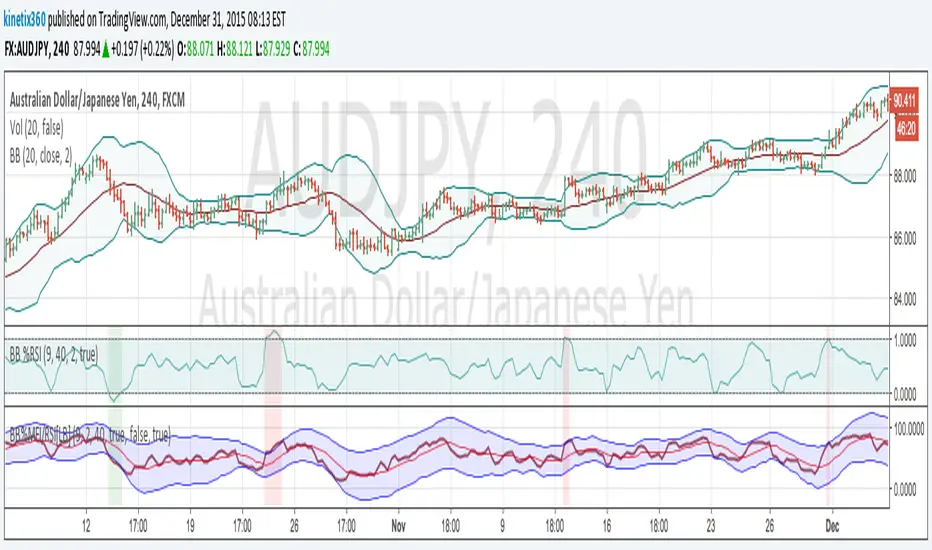
Here is the modification from BB-MFI/RSI from LazyBear. I add the period for the BB as told by John Bollinger in his book.
Base on his book, he suggest to try :
9p RSI with 40p BB and Stdv 2.0
14p RSI with 50p BB and Stdv 2.1
10p MFI with 40p BB and Stdv 2.0
The idea is to compare the short period in indicator with Long period of BB.
Base on his book, he suggest to try :
9p RSI with 40p BB and Stdv 2.0
14p RSI with 50p BB and Stdv 2.1
10p MFI with 40p BB and Stdv 2.0
The idea is to compare the short period in indicator with Long period of BB.
Script open-source
In pieno spirito TradingView, il creatore di questo script lo ha reso open-source, in modo che i trader possano esaminarlo e verificarne la funzionalità. Complimenti all'autore! Sebbene sia possibile utilizzarlo gratuitamente, ricorda che la ripubblicazione del codice è soggetta al nostro Regolamento.
Declinazione di responsabilità
Le informazioni ed i contenuti pubblicati non costituiscono in alcun modo una sollecitazione ad investire o ad operare nei mercati finanziari. Non sono inoltre fornite o supportate da TradingView. Maggiori dettagli nelle Condizioni d'uso.