OPEN-SOURCE SCRIPT
Aggiornato Purchasing Managers Index (PMI)
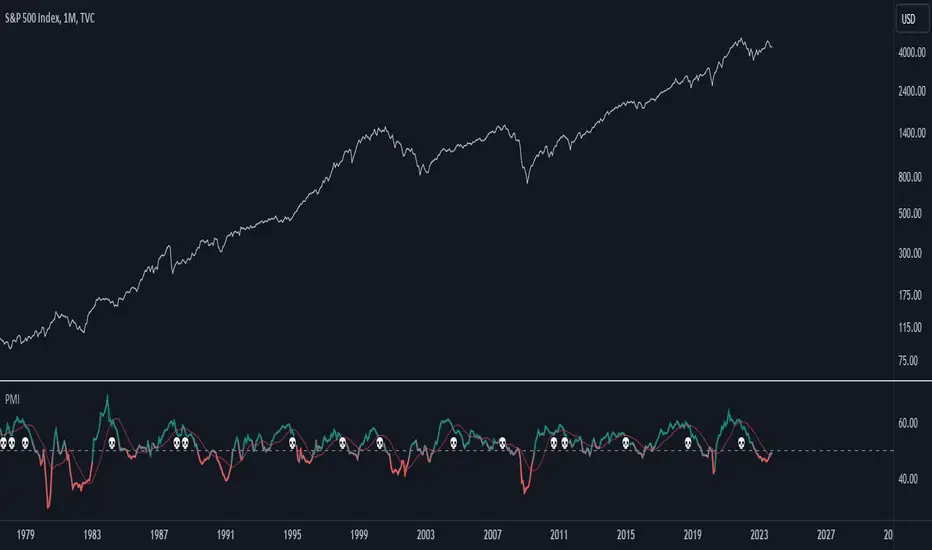
The Purchasing Managers Index (PMI) is a widely recognized economic indicator that provides crucial insights into the health and performance of an economy's manufacturing and services sectors. This index is a vital tool for anticipating economic developments and trends, offering an early warning system for changes in these sectors.
The PMI is calculated based on surveys conducted among purchasing managers in various businesses and organizations. These managers are asked about their perceptions of current business conditions and their expectations for future economic activity within their sectors. The responses are then compiled and used to calculate the PMI value.
A PMI value above 50 typically indicates that the manufacturing or services sector is expanding, suggesting a positive economic outlook. Conversely, a PMI value below 50 suggests contraction, which may be an early indication of economic challenges or a potential recession.
In summary, the Purchasing Managers Index (PMI) is an essential economic indicator that assesses the health of manufacturing and services sectors by surveying purchasing managers' opinions. It serves as an early warning system for changes in economic activity and is a valuable tool for forecasting economic trends and potential crises.
This code combines the Purchasing Managers Index (PMI) data with two Simple Moving Averages (SMA) and some visual elements.
Let's break down how this indicator works:
1. Loading PMI Data:
The indicator loads data for the "USBCOI" symbol, which represents the PMI data. It fetches the monthly closing prices of this symbol.
2. Calculating Moving Averages:
Two Simple Moving Averages (SMAs) are calculated based on the PMI data. The first SMA, sma_usbcoi, has a length defined by the input parameter (default: 2). The second SMA, sma2_usbcoi, has a different length defined by the second input parameter (default: 14).
3. Color Coding and Thresholds:
The line color of the PMI plot is determined based on the value of the PMI. If the PMI is above 52, the color is teal; if it's below 48, the color is red; otherwise, it's gray. These threshold values are often used to identify specific conditions in the PMI data.
4. Crossing Indicator:
A key feature of this indicator is to determine if the PMI crosses the first SMA (sma_usbcoi) from top to bottom while also being above the value of 52. This is indicated by the crossedUp variable. This condition suggests a specific situation where the PMI crosses a short-term moving average while indicating strength (above 52).
5. Visual Elements:
A "💀" skull emoji is defined as skullEmoji.
The PMI is plotted on the chart with color coding based on its value, as described earlier.
The two SMAs are also plotted on the chart.
When the crossedUp condition is met (PMI crosses the first SMA from top to bottom while above 52), a skull emoji (indicating potential danger) is plotted at the top of the indicator window.
Note di rilascio
Source: Purchasing Managers' Index: ISM Report on Business (PMI) ismworld.orgScript open-source
In pieno spirito TradingView, il creatore di questo script lo ha reso open-source, in modo che i trader possano esaminarlo e verificarne la funzionalità. Complimenti all'autore! Sebbene sia possibile utilizzarlo gratuitamente, ricorda che la ripubblicazione del codice è soggetta al nostro Regolamento.
The trend is your friend, until it's not...
Declinazione di responsabilità
Le informazioni ed i contenuti pubblicati non costituiscono in alcun modo una sollecitazione ad investire o ad operare nei mercati finanziari. Non sono inoltre fornite o supportate da TradingView. Maggiori dettagli nelle Condizioni d'uso.
Script open-source
In pieno spirito TradingView, il creatore di questo script lo ha reso open-source, in modo che i trader possano esaminarlo e verificarne la funzionalità. Complimenti all'autore! Sebbene sia possibile utilizzarlo gratuitamente, ricorda che la ripubblicazione del codice è soggetta al nostro Regolamento.
The trend is your friend, until it's not...
Declinazione di responsabilità
Le informazioni ed i contenuti pubblicati non costituiscono in alcun modo una sollecitazione ad investire o ad operare nei mercati finanziari. Non sono inoltre fornite o supportate da TradingView. Maggiori dettagli nelle Condizioni d'uso.