OPEN-SOURCE SCRIPT
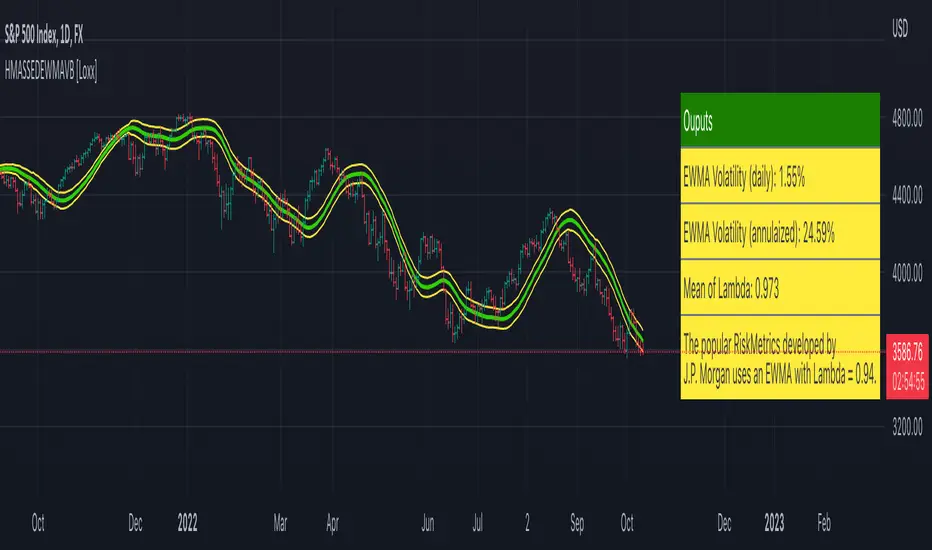
Aggiornato HMA w/ SSE-Dynamic EWMA Volatility Bands [Loxx]
This indicator is for educational purposes to lay the groundwork for future closed/open source indicators. Some of thee future indicators will employ parameter estimation methods described below, others will require complex solvers such as the Nelder-Mead algorithm on log likelihood estimations to derive optimal parameter values for omega, gamma, alpha, and beta for GARCH(1,1) MLE and other volatility metrics. For our purposes here, we estimate the rolling lambda (λ) value used to calculate EWMA by minimizing of the sum of the squared errors minus the long-run variance--a rolling window of the one year mean of squared log-returns. In practice, practitioners will use a λ equal to a standardized value put out by institutions such as JP Morgan. Even simpler than this, others use a ratio of (per - 1) / (per + 1) to derive λ where per is the lookback period for EWMA. Due to computation limits in Pine, we'll likely not see a true GARCH(1,1) MLE on Pine for quite some time, but future closed source indicators will contain some very interesting industry hacks to get close by employing modifications to EWMA. Enjoy!
Exponentially weighted volatility and its relationship to GARCH(1,1)
Exponentially weighted volatility--also called exponentially weighted moving average volatility (EWMA)--puts more weight on more recent observations. EWMA is calculated as follows:
σ*2 = λσ(n - 1)^2 + (1 − λ)u(n - 1)^2
The estimate, σn, of the volatility for day n (made at the end of day n − 1) is calculated from σn −1 (the estimate that was made at the end of day n − 2 of the volatility for day n − 1) and u^n−1 (the most recent daily percentage change).
The EWMA approach has the attractive feature that the data storage requirements are modest. At any given time, we need to remember only the current estimate of the variance rate and the most recent observation on the value of the market variable. When we get a new observation on the value of the market variable, we calculate a new daily percentage change to update our estimate of the variance rate. The old estimate of the variance rate and the old value of the market variable can then be discarded.
The EWMA approach is designed to track changes in the volatility. Suppose there is a big move in the market variable on day n − 1 so that u2n−1 is large. This causes our estimate of the current volatility to move upward. The value of λ governs how responsive the estimate of the daily volatility is to the most recent daily percentage change. A low value of λ leads to a great deal of weight being given to the u(n−1)^2 when σn is calculated. In this case, the estimates produced for the volatility on successive days are themselves highly volatile. A high value of λ (i.e., a value close to 1.0) produces estimates of the daily volatility that respond relatively slowly to new information provided by the daily percentage change.
The RiskMetrics database, which was originally created by JPMorgan and made publicly available in 1994, used the EWMA model with λ = 0.94 for updating daily volatility estimates. The company found that, across a range of different market variables, this value of λ gives forecasts of the variance rate that come closest to the realized variance rate. In 2006, RiskMetrics switched to using a long memory model. This is a model where the weights assigned to the u(n -i)^2 as i increases decline less fast than in EWMA.
GARCH(1,1) Model
The EWMA model is a particular case of GARCH(1,1) where γ = 0, α = 1 − λ, and β = λ. The “(1,1)” in GARCH(1,1) indicates that σ^2 is based on the most recent observation of u^2 and the most recent estimate of the variance rate. The more general GARCH(p, q) model calculates σ^2 from the most recent p observations on u2 and the most recent q estimates of the variance rate.7 GARCH(1,1) is by far the most popular of the GARCH models. Setting ω = γVL, the GARCH(1,1) model can also be written:
σ(n)^2 = ω + αu(n-1)^2 + βσ(n-1)^2
What this indicator does
- Calculate log returns log(close/close(1))
- Calculates Lambda (λ) dynamically by minimizing the sum of squared errors. I've restricted this to the daily timeframe so as to not bloat the code with additional logic required to derive an annualized EWMA historical volatility metric.
- After the Lambda is derived, EWMA is calculated one last time and the result is the daily volatility
- This daily volatility is multiplied by the source and the multiplier +/- the HMA to create the volatility bands
- Finally, daily volatility is multiplied by the square-root of days per year to derive annualized volatility. Years are trading days for the asset, for most everything but crypto, its 252, for crypto is 365.
Note di rilascio
Corrected one small error in lag.Note di rilascio
Performance improvements. - Added fast log2 approximation
- Restricted display bars back to 1000
Script open-source
Nello spirito di TradingView, l'autore di questo script lo ha reso open source, in modo che i trader possano esaminarne e verificarne la funzionalità. Complimenti all'autore! Sebbene sia possibile utilizzarlo gratuitamente, ricordiamo che la ripubblicazione del codice è soggetta al nostro Regolamento.
Public Telegram Group, t.me/algxtrading_public
VIP Membership Info: patreon.com/algxtrading/membership
VIP Membership Info: patreon.com/algxtrading/membership
Declinazione di responsabilità
Le informazioni e le pubblicazioni non sono intese come, e non costituiscono, consulenza o raccomandazioni finanziarie, di investimento, di trading o di altro tipo fornite o approvate da TradingView. Per ulteriori informazioni, consultare i Termini di utilizzo.