PROTECTED SOURCE SCRIPT
Order Blocks & Market Structure (SMC)
# Order Blocks & Market Structure (SMC)
## 📊 Overview
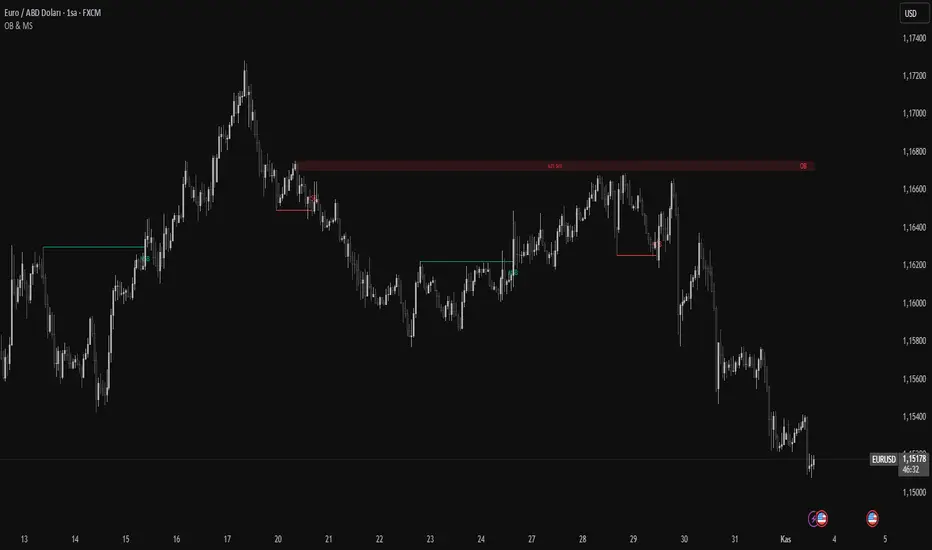
A Smart Money Concepts indicator that identifies institutional order blocks (OB), market structure breaks (MSB), and breaker blocks (BB) with volume-based strength analysis. Designed for traders seeking to identify institutional accumulation/distribution zones and market structure shifts.
## 🎯 Originality Statement
This indicator combines multiple analytical approaches into a unified system:
- **Multi-level OB strength classification** using volume spike detection and body ratio analysis (OB/OB+/OB++)
- **Automatic lifecycle tracking** that converts invalidated Order Blocks to Breaker Blocks with polarity reversal
- **Volume context integration** showing buyer/seller dominance percentage at block formation
- **Dynamic zone extension** that updates OB boundaries until price interaction or invalidation
- **Delayed touch alerts** (5-bar minimum) to filter premature retest signals
Unlike simple order block scripts that only mark zones, this tool provides strength assessment, volume analysis, and intelligent state management throughout the block lifecycle.
## ⚙️ Technical Methodology
**Market Structure Detection:**
Uses pivot-based swing point analysis to identify trend changes. When price closes above a pivot high (bullish MSB) or below a pivot low (bearish MSB), the structure is marked with horizontal reference lines.
**Order Block Identification:**
Searches the specified lookback period for the lowest low (bullish MSB) or highest high (bearish MSB). When a strong directional candle is found (opposite color to trend direction), its range becomes an OB zone.
**Strength Analysis:**
- Compares candle volume against 20-period SMA with configurable multiplier (1.2-3.0x)
- Calculates body-to-range ratio to assess candle strength (0.4-0.8 threshold)
- Assigns strength levels: Standard (no conditions), Strong (one condition), Premium (both conditions)
**Breaker Block Conversion:**
When price closes completely through an OB zone (bullish OB broken downward or bearish OB broken upward), the zone automatically converts to BB with reversed polarity and color.
## 📋 Features
**Market Structure (MSB):**
- Detects bullish and bearish structure breaks
- Configurable swing length (5-50 bars)
- Visual markers with horizontal lines
**Order Blocks (OB):**
- Three strength tiers: OB (standard), OB+ (strong), OB++ (premium)
- Volume percentage display (buyer vs seller dominance)
- Dynamic zone extension until invalidation
**Breaker Blocks (BB):**
- Automatic conversion from failed OBs
- Polarity tracking (bullish ↔ bearish)
- Fixed zones after conversion
## 🔧 Settings Documentation
**Market Structure Group:**
*Show Market Structure* - Enable/disable MSB detection and line drawing
- Default: ON
- When OFF: No structure lines or labels appear
*MSB Labels* - Display text labels at structure break points
- Default: ON
- Labels show "MSB" at the break candle
*Swing Length* - Lookback period for pivot point detection
- Range: 5-50 bars
- Default: 10
- Higher values = longer-term structure, fewer signals
- Lower values = short-term structure, more signals
*Bull Color* - Color for bullish elements (MSB, bullish OB, bullish BB)
- Default: #089981 (green)
*Bear Color* - Color for bearish elements (MSB, bearish OB, bearish BB)
- Default: #f23645 (red)
**Order Block Group:**
*Order Blocks* - Enable/disable OB detection and zone drawing
- Default: ON
- When OFF: No boxes appear (MSB lines still show if enabled)
*OB Strength* - Enable multi-level strength classification
- Default: ON
- When ON: Labels show OB/OB+/OB++ based on analysis
- When OFF: All zones labeled simply as "OB"
*Volume %* - Display buyer/seller volume percentage
- Default: ON
- Shows "X% Buy" or "X% Sell" inside zones
- Calculated over 10 bars from zone formation
*OB Lookback* - How many bars to search for OB candle
- Range: 5-30 bars
- Default: 10
- Searches for lowest low (bullish) or highest high (bearish) within this range
*Vol Threshold* - Minimum volume multiplier for strength upgrade
- Range: 1.2-3.0x
- Default: 1.5x
- Volume must exceed (20-period SMA × threshold) for OB+ or OB++
*Body Ratio* - Minimum body-to-range ratio for strength upgrade
- Range: 0.4-0.8
- Default: 0.6
- Candle body must be at least this proportion of total range for OB+ or OB++
## 📖 How to Use
**For Trend Following:**
1. Wait for MSB in your desired direction
2. OB forms in the breakout area (the institutional entry zone)
3. Price may immediately continue or pull back to retest OB
4. Enter on OB retest with "OB Touch" alert (after 5+ bars from creation)
5. Higher strength OB (OB+, OB++) indicates stronger institutional activity
**For Reversal Trading:**
1. Identify Breaker Blocks (former OBs that failed)
2. BB represents potential reversal zone with opposite polarity
3. Wait for MSB in BB direction for confirmation
4. Enter on pullback to BB zone
**Volume Analysis:**
- 70%+ Buy/Sell dominance = strong institutional bias
- 60-70% = moderate bias
- 50-60% = weak bias, use caution
**Optimal Conditions:**
- Works best on trending markets (4H, Daily, Weekly timeframes)
- Less effective in tight ranges or low-volume periods
- Major pairs/assets with good liquidity recommended
## 🔔 Alert Conditions (8 Types)
The indicator provides the following alerts:
1. **Bullish MSB** - Upward market structure break detected
2. **Bearish MSB** - Downward market structure break detected
3. **Bullish OB Created** - New bullish order block formed
4. **Bearish OB Created** - New bearish order block formed
5. **Bullish BB Created** - Bearish OB converted to bullish BB
6. **Bearish BB Created** - Bullish OB converted to bearish BB
7. **Bullish OB Touch** - Price revisited bullish OB (minimum 5 bars after creation)
8. **Bearish OB Touch** - Price revisited bearish OB (minimum 5 bars after creation)
Touch alerts include a 5-bar delay to avoid alerting on immediate continuation moves.
## ⚠️ Limitations & Risk Disclosure
**Known Limitations:**
- MSB signals can produce whipsaws in ranging or choppy markets
- Not all OB touches result in successful trades
- OB zones may be tested multiple times before activation
- Volume data may be unavailable or unreliable on some instruments/exchanges
- Strength analysis requires sufficient volume history
- Historical repainting: OB zones extend dynamically as price interacts with them
**Risk Considerations:**
This indicator is designed for educational and analytical purposes. It identifies potential institutional zones but does not predict price movement. Past identification of zones does not guarantee future trading success. OB and BB zones represent areas of interest, not guaranteed support/resistance. Always use proper risk management, combine with other analysis methods, and never risk more than you can afford to lose.
## 🎨 Visual Guide
**Colors & Symbols:**
- 🟢 Green boxes = Bullish Order Blocks / Bullish Breaker Blocks
- 🔴 Red boxes = Bearish Order Blocks / Bearish Breaker Blocks
- Horizontal lines = Market Structure Break levels
- "MSB" labels = Structure break points (above/below line)
- "OB" / "OB+" / "OB++" labels = Order Block strength (right side of box)
- "BB" labels = Breaker Block (converted from OB)
- "X% Buy/Sell" labels = Volume analysis (center of box)
**Box Behavior:**
- OB zones extend to the right as long as price interacts with them (not broken)
- When OB is invalidated, it stops extending and converts to BB
- BB zones remain fixed at their invalidation point
## 💡 Best Practices
- Focus on OB+ and OB++ zones for higher probability setups
- Confirm OB touches with price action (rejection wicks, engulfing patterns)
- Use multiple timeframe analysis (Daily OB + 4H entry)
- Avoid trading in the first 1-2 bars after OB creation (wait for touch alert)
- Consider volume % - avoid zones with <60% dominance
- Combine with other confluence factors (Fibonacci, support/resistance)
- Set realistic stop losses beyond the OB/BB zone
---
**Version:** 1.0
**Pine Script:** Version 6
**Category:** Smart Money Concepts, Order Flow, Market Structure
For questions or suggestions, use the TradingView comments section below.
## 📊 Overview
A Smart Money Concepts indicator that identifies institutional order blocks (OB), market structure breaks (MSB), and breaker blocks (BB) with volume-based strength analysis. Designed for traders seeking to identify institutional accumulation/distribution zones and market structure shifts.
## 🎯 Originality Statement
This indicator combines multiple analytical approaches into a unified system:
- **Multi-level OB strength classification** using volume spike detection and body ratio analysis (OB/OB+/OB++)
- **Automatic lifecycle tracking** that converts invalidated Order Blocks to Breaker Blocks with polarity reversal
- **Volume context integration** showing buyer/seller dominance percentage at block formation
- **Dynamic zone extension** that updates OB boundaries until price interaction or invalidation
- **Delayed touch alerts** (5-bar minimum) to filter premature retest signals
Unlike simple order block scripts that only mark zones, this tool provides strength assessment, volume analysis, and intelligent state management throughout the block lifecycle.
## ⚙️ Technical Methodology
**Market Structure Detection:**
Uses pivot-based swing point analysis to identify trend changes. When price closes above a pivot high (bullish MSB) or below a pivot low (bearish MSB), the structure is marked with horizontal reference lines.
**Order Block Identification:**
Searches the specified lookback period for the lowest low (bullish MSB) or highest high (bearish MSB). When a strong directional candle is found (opposite color to trend direction), its range becomes an OB zone.
**Strength Analysis:**
- Compares candle volume against 20-period SMA with configurable multiplier (1.2-3.0x)
- Calculates body-to-range ratio to assess candle strength (0.4-0.8 threshold)
- Assigns strength levels: Standard (no conditions), Strong (one condition), Premium (both conditions)
**Breaker Block Conversion:**
When price closes completely through an OB zone (bullish OB broken downward or bearish OB broken upward), the zone automatically converts to BB with reversed polarity and color.
## 📋 Features
**Market Structure (MSB):**
- Detects bullish and bearish structure breaks
- Configurable swing length (5-50 bars)
- Visual markers with horizontal lines
**Order Blocks (OB):**
- Three strength tiers: OB (standard), OB+ (strong), OB++ (premium)
- Volume percentage display (buyer vs seller dominance)
- Dynamic zone extension until invalidation
**Breaker Blocks (BB):**
- Automatic conversion from failed OBs
- Polarity tracking (bullish ↔ bearish)
- Fixed zones after conversion
## 🔧 Settings Documentation
**Market Structure Group:**
*Show Market Structure* - Enable/disable MSB detection and line drawing
- Default: ON
- When OFF: No structure lines or labels appear
*MSB Labels* - Display text labels at structure break points
- Default: ON
- Labels show "MSB" at the break candle
*Swing Length* - Lookback period for pivot point detection
- Range: 5-50 bars
- Default: 10
- Higher values = longer-term structure, fewer signals
- Lower values = short-term structure, more signals
*Bull Color* - Color for bullish elements (MSB, bullish OB, bullish BB)
- Default: #089981 (green)
*Bear Color* - Color for bearish elements (MSB, bearish OB, bearish BB)
- Default: #f23645 (red)
**Order Block Group:**
*Order Blocks* - Enable/disable OB detection and zone drawing
- Default: ON
- When OFF: No boxes appear (MSB lines still show if enabled)
*OB Strength* - Enable multi-level strength classification
- Default: ON
- When ON: Labels show OB/OB+/OB++ based on analysis
- When OFF: All zones labeled simply as "OB"
*Volume %* - Display buyer/seller volume percentage
- Default: ON
- Shows "X% Buy" or "X% Sell" inside zones
- Calculated over 10 bars from zone formation
*OB Lookback* - How many bars to search for OB candle
- Range: 5-30 bars
- Default: 10
- Searches for lowest low (bullish) or highest high (bearish) within this range
*Vol Threshold* - Minimum volume multiplier for strength upgrade
- Range: 1.2-3.0x
- Default: 1.5x
- Volume must exceed (20-period SMA × threshold) for OB+ or OB++
*Body Ratio* - Minimum body-to-range ratio for strength upgrade
- Range: 0.4-0.8
- Default: 0.6
- Candle body must be at least this proportion of total range for OB+ or OB++
## 📖 How to Use
**For Trend Following:**
1. Wait for MSB in your desired direction
2. OB forms in the breakout area (the institutional entry zone)
3. Price may immediately continue or pull back to retest OB
4. Enter on OB retest with "OB Touch" alert (after 5+ bars from creation)
5. Higher strength OB (OB+, OB++) indicates stronger institutional activity
**For Reversal Trading:**
1. Identify Breaker Blocks (former OBs that failed)
2. BB represents potential reversal zone with opposite polarity
3. Wait for MSB in BB direction for confirmation
4. Enter on pullback to BB zone
**Volume Analysis:**
- 70%+ Buy/Sell dominance = strong institutional bias
- 60-70% = moderate bias
- 50-60% = weak bias, use caution
**Optimal Conditions:**
- Works best on trending markets (4H, Daily, Weekly timeframes)
- Less effective in tight ranges or low-volume periods
- Major pairs/assets with good liquidity recommended
## 🔔 Alert Conditions (8 Types)
The indicator provides the following alerts:
1. **Bullish MSB** - Upward market structure break detected
2. **Bearish MSB** - Downward market structure break detected
3. **Bullish OB Created** - New bullish order block formed
4. **Bearish OB Created** - New bearish order block formed
5. **Bullish BB Created** - Bearish OB converted to bullish BB
6. **Bearish BB Created** - Bullish OB converted to bearish BB
7. **Bullish OB Touch** - Price revisited bullish OB (minimum 5 bars after creation)
8. **Bearish OB Touch** - Price revisited bearish OB (minimum 5 bars after creation)
Touch alerts include a 5-bar delay to avoid alerting on immediate continuation moves.
## ⚠️ Limitations & Risk Disclosure
**Known Limitations:**
- MSB signals can produce whipsaws in ranging or choppy markets
- Not all OB touches result in successful trades
- OB zones may be tested multiple times before activation
- Volume data may be unavailable or unreliable on some instruments/exchanges
- Strength analysis requires sufficient volume history
- Historical repainting: OB zones extend dynamically as price interacts with them
**Risk Considerations:**
This indicator is designed for educational and analytical purposes. It identifies potential institutional zones but does not predict price movement. Past identification of zones does not guarantee future trading success. OB and BB zones represent areas of interest, not guaranteed support/resistance. Always use proper risk management, combine with other analysis methods, and never risk more than you can afford to lose.
## 🎨 Visual Guide
**Colors & Symbols:**
- 🟢 Green boxes = Bullish Order Blocks / Bullish Breaker Blocks
- 🔴 Red boxes = Bearish Order Blocks / Bearish Breaker Blocks
- Horizontal lines = Market Structure Break levels
- "MSB" labels = Structure break points (above/below line)
- "OB" / "OB+" / "OB++" labels = Order Block strength (right side of box)
- "BB" labels = Breaker Block (converted from OB)
- "X% Buy/Sell" labels = Volume analysis (center of box)
**Box Behavior:**
- OB zones extend to the right as long as price interacts with them (not broken)
- When OB is invalidated, it stops extending and converts to BB
- BB zones remain fixed at their invalidation point
## 💡 Best Practices
- Focus on OB+ and OB++ zones for higher probability setups
- Confirm OB touches with price action (rejection wicks, engulfing patterns)
- Use multiple timeframe analysis (Daily OB + 4H entry)
- Avoid trading in the first 1-2 bars after OB creation (wait for touch alert)
- Consider volume % - avoid zones with <60% dominance
- Combine with other confluence factors (Fibonacci, support/resistance)
- Set realistic stop losses beyond the OB/BB zone
---
**Version:** 1.0
**Pine Script:** Version 6
**Category:** Smart Money Concepts, Order Flow, Market Structure
For questions or suggestions, use the TradingView comments section below.
Script protetto
Questo script è pubblicato come codice protetto. Tuttavia, è possibile utilizzarle liberamente e senza alcuna limitazione – ulteriori informazioni qui.
Developer & Trader
Declinazione di responsabilità
Le informazioni e le pubblicazioni non sono intese come, e non costituiscono, consulenza o raccomandazioni finanziarie, di investimento, di trading o di altro tipo fornite o approvate da TradingView. Per ulteriori informazioni, consultare i Termini di utilizzo.