PROTECTED SOURCE SCRIPT
Aggiornato Percentage Range High/Low Levels
Percentage Range High/Low Levels Indicator
Overview
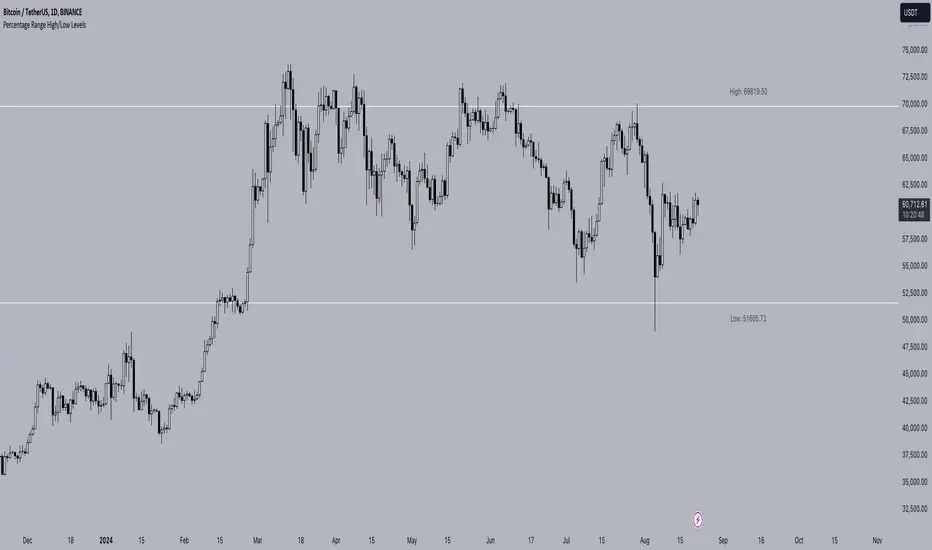
The "Percentage High/Low Levels" indicator is a versatile tool designed to help traders visualize key price levels that are a certain percentage away from the current price. Instead of using traditional volatility measures like the Average True Range (ATR), this script allows traders to plot lines above and below the current price based on a user-defined percentage. These levels can act as potential support and resistance zones, helping traders in decision-making processes such as setting targets, stop-losses, or identifying overbought and oversold conditions.
How It Works
How to Use
Concepts Underlying the Calculation
The indicator is based on the concept of price percentage levels, which are straightforward yet powerful tools in technical analysis. Unlike volatility-based indicators that adapt to changing market conditions, percentage levels provide fixed reference points, allowing traders to gauge potential price movements in a consistent manner. This can be particularly useful in trending markets, where the price often respects certain percentage-based levels as it progresses in its direction.
By offering a clear, customizable approach to plotting these levels, the "Percentage High/Low Levels" indicator becomes a valuable addition to any trader's toolkit, regardless of the market or timeframe they are working with.
Best Practices
This indicator is suitable for traders looking to incorporate a systematic approach to identifying key price levels that are easy to interpret and adjust according to market conditions.
Overview
The "Percentage High/Low Levels" indicator is a versatile tool designed to help traders visualize key price levels that are a certain percentage away from the current price. Instead of using traditional volatility measures like the Average True Range (ATR), this script allows traders to plot lines above and below the current price based on a user-defined percentage. These levels can act as potential support and resistance zones, helping traders in decision-making processes such as setting targets, stop-losses, or identifying overbought and oversold conditions.
How It Works
- Percentage-Based Calculation:
The script calculates two levels: a high level and a low level. These are determined by adding and subtracting a specified percentage from the current price. For example, if you set the percentage to 1%, the script will plot a line 1% above the current price (high level) and another line 1% below the current price (low level). - Timeframe Selection:
You can choose the timeframe over which the percentage levels are calculated. This means that the levels can be based on different timeframes, such as daily, weekly, or monthly data, depending on your trading strategy. - Customization Options:Line Extension: The lines can be extended to the left, right, both directions, or neither, depending on your preference.
Colors: You can customize the colors of both the high and low lines and their respective labels.
Label Size: The size of the labels can be adjusted, allowing you to tailor the visibility of the levels to your charting needs. - Label Placement and Styling:
The labels indicating the price levels are placed above the lines to keep your chart clean and readable. The labels are transparent and do not have a background, ensuring they don't obscure any important chart information. You can also adjust the distance of the labels from the current bar using the label offset feature.
How to Use
- Selecting the Percentage:
Choose a percentage that aligns with your trading strategy. A smaller percentage might be useful for intraday trading, while a larger percentage could be more appropriate for swing or position trading. - Choosing the Timeframe:
Set the timeframe to match the period over which you are analyzing the market. For example, if you are trading on a daily chart, you might want to select the daily timeframe. - Customizing Visuals:
Use the input options to adjust the colors, label sizes, and line extensions according to your preference. This helps in maintaining a chart setup that is both functional and visually appealing. - Interpreting the Levels:
The high and low levels can act as dynamic support and resistance levels. If the price approaches one of these levels, it may either reverse or break through, depending on the market conditions. Traders can use these levels to set stop-loss orders, take-profit targets, or even enter new positions based on price action around these zones.
Concepts Underlying the Calculation
The indicator is based on the concept of price percentage levels, which are straightforward yet powerful tools in technical analysis. Unlike volatility-based indicators that adapt to changing market conditions, percentage levels provide fixed reference points, allowing traders to gauge potential price movements in a consistent manner. This can be particularly useful in trending markets, where the price often respects certain percentage-based levels as it progresses in its direction.
By offering a clear, customizable approach to plotting these levels, the "Percentage High/Low Levels" indicator becomes a valuable addition to any trader's toolkit, regardless of the market or timeframe they are working with.
Best Practices
- Testing and Validation: Before using this indicator in live trading, it is advisable to test it on historical data or in a demo environment to understand how it behaves in different market conditions.
- Combination with Other Indicators: For enhanced accuracy, consider using this indicator in combination with trend indicators (like moving averages) or momentum oscillators (like RSI) to confirm potential reversal points or breakouts.
This indicator is suitable for traders looking to incorporate a systematic approach to identifying key price levels that are easy to interpret and adjust according to market conditions.
Note di rilascio
Amendment to the visibility settings, visible on all timeframes.Script protetto
Questo script è pubblicato come codice protetto. Tuttavia, è possibile utilizzarle liberamente e senza alcuna limitazione – ulteriori informazioni qui.
Declinazione di responsabilità
Le informazioni e le pubblicazioni non sono intese come, e non costituiscono, consulenza o raccomandazioni finanziarie, di investimento, di trading o di altro tipo fornite o approvate da TradingView. Per ulteriori informazioni, consultare i Termini di utilizzo.
Script protetto
Questo script è pubblicato come codice protetto. Tuttavia, è possibile utilizzarle liberamente e senza alcuna limitazione – ulteriori informazioni qui.
Declinazione di responsabilità
Le informazioni e le pubblicazioni non sono intese come, e non costituiscono, consulenza o raccomandazioni finanziarie, di investimento, di trading o di altro tipo fornite o approvate da TradingView. Per ulteriori informazioni, consultare i Termini di utilizzo.