OPEN-SOURCE SCRIPT
Historical Volatility Scale [ChartPrime]
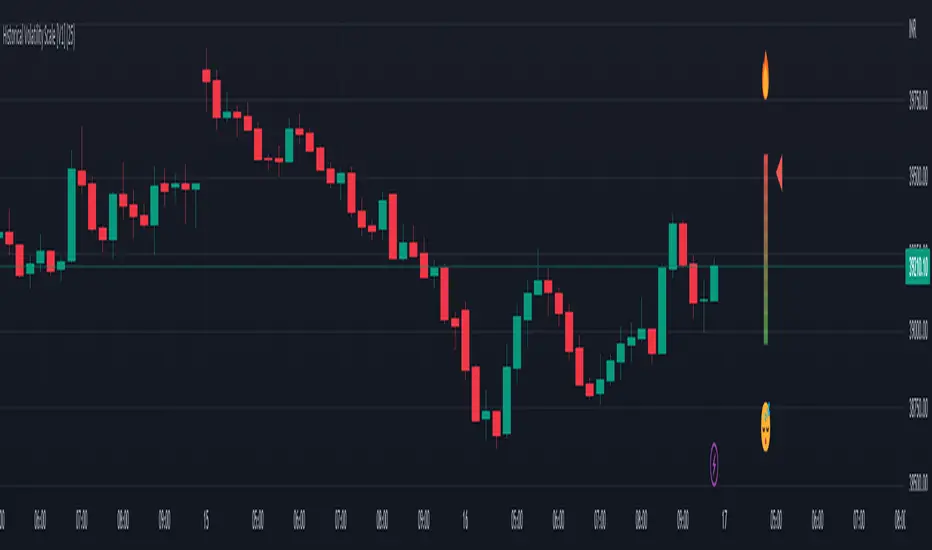
This indicator outputs a visual scale representing the level of volatility in the market relative to the timeframe selected on the users chart. The method of volatility used is "historical volatility" which is calculated by taking the standard deviation of a series of "x" length which contains the current closing price divided by the previous closing price for all nodes. The output of the volatility is standardized by also running an additional percentrank calculation over the raw volatility values to allow the volatility scale to oscillate properly between its minimum of 0 and maximum of 100.
📗 SETTINGS
🧰 UTILITY

The arrow or "The Pin" will move upwards towards the "fire" emoji when the volatility is higher than the majority of values for the amount of bars back that you set the "length" setting to. Vise Versa for when the pin is lowering towards the "snooze" emoji, the volatility is less than the majority of nodes/values for the past "length" amount of values.
When the volatility is low, a trader could consider utilizing more leading indicators to make their trading decisions as opposed to lagging indicator such as trend indicators. When the volatility is low, the price action is consolidation which would be bad for a trend following strategy. Vise Versa for trend strategies, having a higher volatility may be better for such strategies.
Its important to remember that this indicator itself is a lagging indicator, in that it relies on historical data to showcase the current state of the markets volatility. This means that although the recommendation in the previous paragraph may make logical sense, it is not a guarantee that if the volatility is showcasing a trending market, that your trend strategies will necessarily be profitable.
📗 SETTINGS
- Length: The length determines how many bars/nodes should be considered when calculating the standard deviation. In simple terms, the higher the length, the less sensitive and less reactive the scale will be to current price action, and larger moves would be required to trigger the scale.
🧰 UTILITY
The arrow or "The Pin" will move upwards towards the "fire" emoji when the volatility is higher than the majority of values for the amount of bars back that you set the "length" setting to. Vise Versa for when the pin is lowering towards the "snooze" emoji, the volatility is less than the majority of nodes/values for the past "length" amount of values.
When the volatility is low, a trader could consider utilizing more leading indicators to make their trading decisions as opposed to lagging indicator such as trend indicators. When the volatility is low, the price action is consolidation which would be bad for a trend following strategy. Vise Versa for trend strategies, having a higher volatility may be better for such strategies.
Its important to remember that this indicator itself is a lagging indicator, in that it relies on historical data to showcase the current state of the markets volatility. This means that although the recommendation in the previous paragraph may make logical sense, it is not a guarantee that if the volatility is showcasing a trending market, that your trend strategies will necessarily be profitable.
Script open-source
In pieno spirito TradingView, il creatore di questo script lo ha reso open-source, in modo che i trader possano esaminarlo e verificarne la funzionalità. Complimenti all'autore! Sebbene sia possibile utilizzarlo gratuitamente, ricorda che la ripubblicazione del codice è soggetta al nostro Regolamento.
Declinazione di responsabilità
Le informazioni ed i contenuti pubblicati non costituiscono in alcun modo una sollecitazione ad investire o ad operare nei mercati finanziari. Non sono inoltre fornite o supportate da TradingView. Maggiori dettagli nelle Condizioni d'uso.