OPEN-SOURCE SCRIPT
Three EMA Crossover Trading Strategy
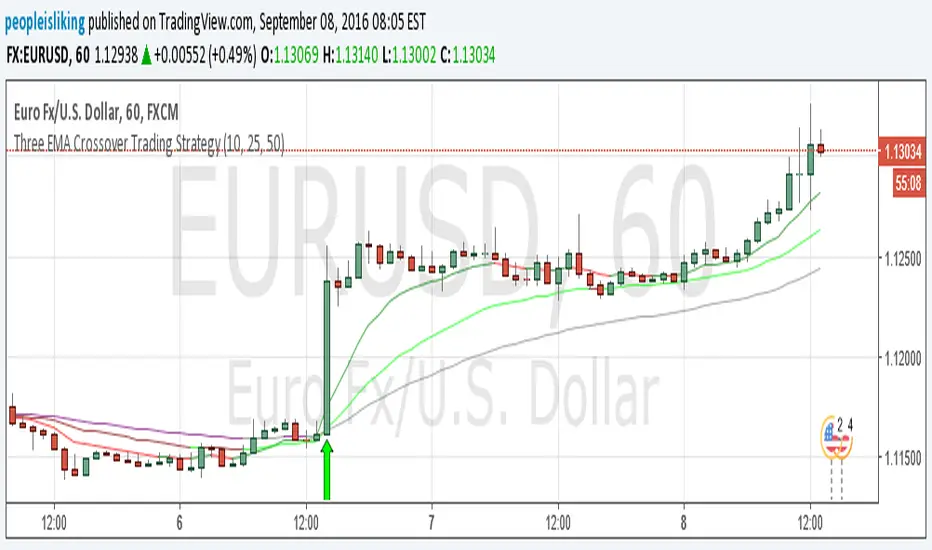
Use it with any forex currency pair or any stock with any timeframe.
It is a trend following trading strategy so works best in trending market.
So once you identify the market is trading you just simply use this trading strategy.
Video Explanation : Youtube
Detail Explanation : https://www.peopleisliking.com
It is a trend following trading strategy so works best in trending market.
So once you identify the market is trading you just simply use this trading strategy.
Video Explanation : Youtube
Detail Explanation : https://www.peopleisliking.com
Script open-source
In pieno spirito TradingView, il creatore di questo script lo ha reso open-source, in modo che i trader possano esaminarlo e verificarne la funzionalità. Complimenti all'autore! Sebbene sia possibile utilizzarlo gratuitamente, ricorda che la ripubblicazione del codice è soggetta al nostro Regolamento.
Declinazione di responsabilità
Le informazioni ed i contenuti pubblicati non costituiscono in alcun modo una sollecitazione ad investire o ad operare nei mercati finanziari. Non sono inoltre fornite o supportate da TradingView. Maggiori dettagli nelle Condizioni d'uso.