Nifty's Indicator
Use it in only in 3m and 1m timeframe. No other timeframe is to be used.
This indicator gives only sell signals on intraday basis.
When you apply this indicator on charts then you will see 2 things ploted there.
1. Barcolor
2. Background color
Barcolor :
We have use unique trend analysing tool in this indicator, which identifies price is in Uptrend or Downtrend. If price is in uptrend
then candle color will become GREEN and it will remain green until price comes in downtrend. In downtrend candle color becomes RED.
Background color :
We have observed that price behaves a certain way when it is in downtrend. So we try to catch that behaviour of Nifty and Banknifty .
And when ever we observe that behaviour, a red color background is formed in background. This red color background indicates user that
price may fall now.
HOW TO USE :
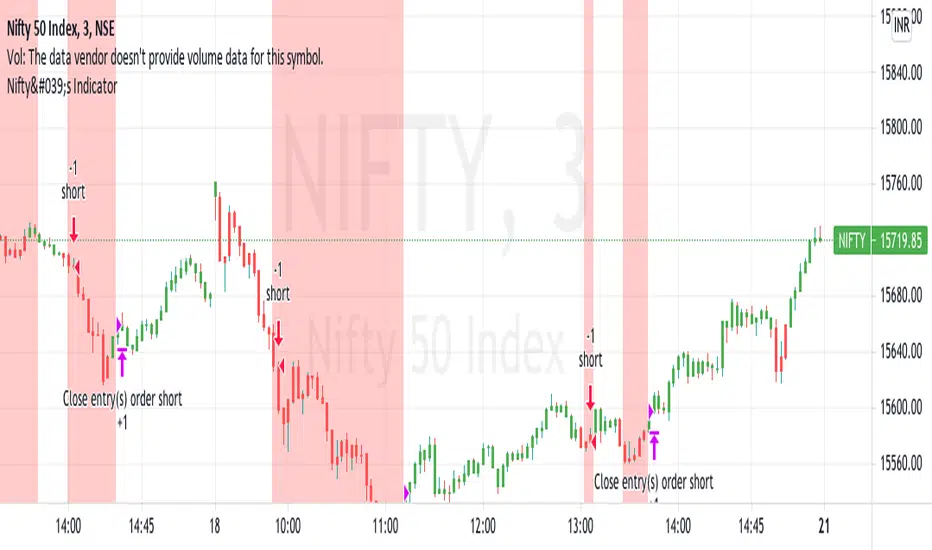
ENTRY => You should trade only on 3m timeframe. When you see a RED COLOR candle inside RED ZONE then take a SELL trade. That means red background
is indicating that price may fall and red color bar also indicating the same. And your entry should be in between 09:15-10:30 and 12:30-14:55.
This is the time slot when price is volatile.
EXIT => You exit when red zone ends or the trading day ends.
BACKTESTING :
Based on these entry and exit conditions , we have backtested this strategy ( taking only 1 share when sell signal comes ). You can see down arrow on
chart when sell signals comes and uparrow when we exit from trade.
Use it in only in 3m and 1m timeframe. No other timeframe is to be used.
This indicator gives only sell signals on intraday basis.
When you apply this indicator on charts then you will see 2 things ploted there.
1. Barcolor
2. Background color
Barcolor :
We have use unique trend analysing tool in this indicator, which identifies price is in Uptrend or Downtrend. If price is in uptrend
then candle color will become GREEN and it will remain green until price comes in downtrend. In downtrend candle color becomes RED.
Background color :
We have observed that price behaves a certain way when it is in downtrend. So we try to catch that behaviour of Nifty and Banknifty .
And when ever we observe that behaviour, a red color background is formed in background. This red color background indicates user that
price may fall now.
HOW TO USE :
ENTRY => You should trade only on 3m timeframe. When you see a RED COLOR candle inside RED ZONE then take a SELL trade. That means red background
is indicating that price may fall and red color bar also indicating the same. And your entry should be in between 09:15-10:30 and 12:30-14:55.
This is the time slot when price is volatile.
EXIT => You exit when red zone ends or the trading day ends.
BACKTESTING :
Based on these entry and exit conditions , we have backtested this strategy ( taking only 1 share when sell signal comes ). You can see down arrow on
chart when sell signals comes and uparrow when we exit from trade.
Script su invito
Solo gli utenti autorizzati dall'autore hanno accesso a questo script e ciò richiede solitamente un pagamento. Puoi aggiungere lo script ai tuoi preferiti, ma potrai utilizzarlo solo dopo aver richiesto l'autorizzazione e averla ottenuta dal suo autore - per saperne di più leggi qui. Per maggiori dettagli, segui le istruzioni dell'autore qui sotto o contatta direttamente KapoorChandra.
TradingView NON consiglia di pagare o utilizzare uno script a meno che non ci si fidi pienamente del suo autore e non si comprenda il suo funzionamento. Puoi anche trovare alternative gratuite e open-source nei nostri script della comunità.
Istruzioni dell'autore
Attenzione: prima di richiedere l'accesso, leggi la nostra guida per gli script su invito.
Declinazione di responsabilità
Script su invito
Solo gli utenti autorizzati dall'autore hanno accesso a questo script e ciò richiede solitamente un pagamento. Puoi aggiungere lo script ai tuoi preferiti, ma potrai utilizzarlo solo dopo aver richiesto l'autorizzazione e averla ottenuta dal suo autore - per saperne di più leggi qui. Per maggiori dettagli, segui le istruzioni dell'autore qui sotto o contatta direttamente KapoorChandra.
TradingView NON consiglia di pagare o utilizzare uno script a meno che non ci si fidi pienamente del suo autore e non si comprenda il suo funzionamento. Puoi anche trovare alternative gratuite e open-source nei nostri script della comunità.
Istruzioni dell'autore
Attenzione: prima di richiedere l'accesso, leggi la nostra guida per gli script su invito.