OPEN-SOURCE SCRIPT
Aggiornato Swing Data - ADR% / RVol / PVol / Float % / Avg $ Vol
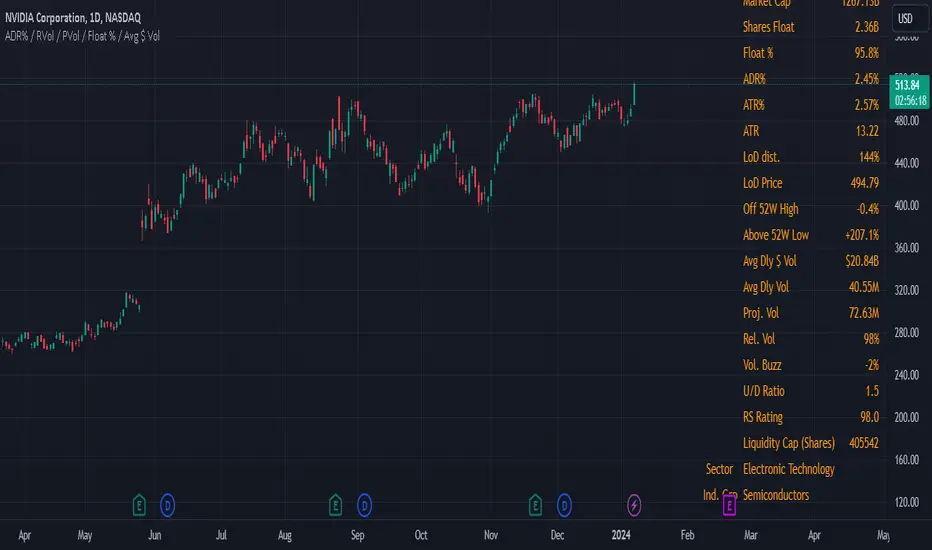
This table presents consolidated data that swing traders can refer to quickly for their benefit. I am of the firm belief that the information provided in this uncomplicated table is precisely what you require to optimize your trading efficiency, and ultimately, profitability.
The data includes;
1. Market Capitalization - a measure of the total value of a publicly traded company's outstanding shares.
2. Float % - the percentage of a company's outstanding shares that are available for trading on the open market. It is calculated by dividing the number of a company's outstanding shares that are available for trading on the open market by the total number of outstanding shares. A lower float percentage generally means that there are fewer shares available for trading, which can lead to increased volatility in the stock price. On the other hand, a higher float percentage generally means that there are more shares available for trading, which can lead to greater stability in the stock price.
3. ADR% - a technical analysis indicator that measures the average daily price movement as a percentage of its current price. It is calculated by taking the difference between the average high and low prices for a time period, and then dividing it by the current price. The resulting value is then multiplied by 100 to give the ADR% for that day. The ADR% can be useful for traders to assess the potential volatility of a stock. A higher ADR% indicates a greater potential for price movement.
4. ATR - measures the range of price movements of an asset over a specified period of time, taking into account any gaps in price. It is calculated by taking the highest value of the following three values:
The difference between the current high and the current low
The absolute value of the difference between the current high and the previous close
The absolute value of the difference between the current low and the previous close
The resulting value is then averaged over the specified period of time to create the ATR value. This indicator is reflects the average volatility of the asset over the specified period of time.
5. LoD dist. - also refer to Low Of Day distance, a range level gauge of current price based on historical volatility of the price movement, in this case I use ATR. for the historical volatility. Please find below as example for the calculation.
eg. LoD dist. = 104%
Current price (A) = $24.49
Low Price (B) = $22.16
Difference (A) - (B) = $2.33
ATR = $2.25
LoD dist = $2.33 / $2.25 = 103.55% (round up to nearest whole number = 104%)
6. Average Daily $ Volume - used to measure the average amount of money that is traded in a stock or a security over a particular period of time, typically a day. It is calculated by multiplying the average daily trading volume of a security by its average price.
7. Average Daily Volume - used to measure the average no. of share that is traded in a stock or a security over a particular period of time, typically a day.
8. Projected Volume - an estimate of the total volume of trading activity that is expected to occur for the day (from the specific time data), based on an average volume over a specific period of time. Projected volume can be used by traders and investors to help make informed decisions about buying or selling securities, and can also be used as an indicator of market sentiment and volatility. However, it's important to note that projected volume is an estimate and actual trading activity may vary.
9. Relative Volume - a measure of the volume of a stock that is trading at the specific time, relative to its average trading volume over a longer period. It is expressed as a percentage and is often used by traders and investors to identify stocks that are trading with higher or lower than usual volume.
Note di rilascio
please update as the earlier version have arithmetical error of 'K' , 'M', ''B'' due to misalignment of the coding.i have re-adjusted and now it is ready to go!
Note di rilascio
updated chart as a cleaner reference of the indicatorNote di rilascio
updated - Note: R Vol, P Vol, Avg $ Vol and Avg Vol all able to run on lower timeframe Note di rilascio
updated with 4 various font sizing option Note di rilascio
include volume buzzNote di rilascio
Added Sector and Industry Group optionNote di rilascio
Added 1. Liquidity Cap (based on 1% of average volume MA length) as value
2. IBD RS Rating as value in 1 decimal point
3. Up/Down volume ratio
4. ATR%
5. Low of Day Price $
6. % Distance from 52-Weeks High
7. % Distance from 52-Weeks Low
8. Share Float in shares (million)
9. options for alignment, and relocation
Note di rilascio
adjustment to displayNote di rilascio
adjustment to chartNote di rilascio
Update to remove plot line option (error)Note di rilascio
-fixed the market cap discrepancy, thanks to TradingView for assisting on offering the right code to get the accurate market cap-data now are sync to the timeframe of the chart you are viewing, suitable for lower timeframe traders
appreciate @DumbleDax (x) for the work and @lacedtrades (x) for bringing this up! great twitter/x community we have!
Note di rilascio
updated for higher timeframe as well (weekly, monthly etc)Note di rilascio
Updated- Accuracy of Share Float Data & Float %
Note di rilascio
Update:- allow display on cryptocurrencies
- allow vertical display adjustment of data
Note di rilascio
include;1. Include SPDR Sector RS Rating Value next to existing 'Sector' display (Purpose: Immediate reference to sector RS Rating for stock of interest eg.
2. Include live Intraday % Change of SPDR Sector (Purpose: immediate reference at point of entry of RS vs sectoral strength eg.
Script open-source
Nello spirito di TradingView, l'autore di questo script lo ha reso open source, in modo che i trader possano esaminarne e verificarne la funzionalità. Complimenti all'autore! Sebbene sia possibile utilizzarlo gratuitamente, ricordiamo che la ripubblicazione del codice è soggetta al nostro Regolamento.
Declinazione di responsabilità
Le informazioni e le pubblicazioni non sono intese come, e non costituiscono, consulenza o raccomandazioni finanziarie, di investimento, di trading o di altro tipo fornite o approvate da TradingView. Per ulteriori informazioni, consultare i Termini di utilizzo.