PROTECTED SOURCE SCRIPT
Aggiornato JamesCart's Feigenbaum Constant/Rate Of Change indicator
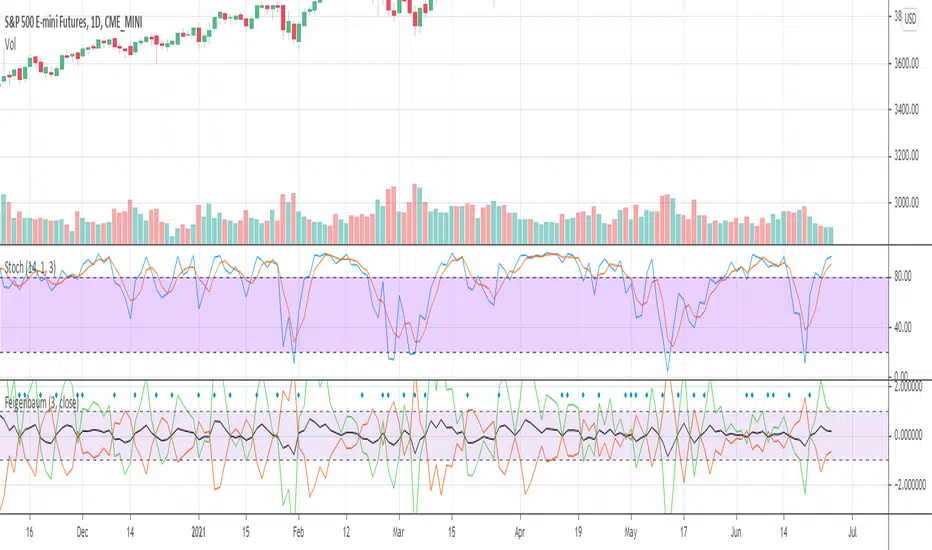
This is an indicator that compares the rate of change as a proportion to the Feigenbaum Constant (The black line). The green line is a positive divergence from the rate of change, the red is a negative divergence from the rate of change. When the Red line is on top and the green line is on the bottom, then that is a bearish trend. When the Green is on top and the red is on bottom, that is a bullish trend. The black line also helps indicate a general bullish or bearish trend based on how it moves.
When the lines "open up" that means a trend is beginning, when the lines close that means the trend is ending. This indicator is a powerful leading indicator and needs sensitive eyes. Every small movement needs to be given consideration.
When the lines "open up" that means a trend is beginning, when the lines close that means the trend is ending. This indicator is a powerful leading indicator and needs sensitive eyes. Every small movement needs to be given consideration.
Note di rilascio
added resolution gaps to fix issues with custom timeframes. Note di rilascio
added an area between 1 and -1 to make it easier to visually find large deviations from market noise.Script protetto
Questo script è pubblicato come codice protetto. Tuttavia, è possibile utilizzarle liberamente e senza alcuna limitazione – ulteriori informazioni qui.
Declinazione di responsabilità
Le informazioni e le pubblicazioni non sono intese come, e non costituiscono, consulenza o raccomandazioni finanziarie, di investimento, di trading o di altro tipo fornite o approvate da TradingView. Per ulteriori informazioni, consultare i Termini di utilizzo.
Script protetto
Questo script è pubblicato come codice protetto. Tuttavia, è possibile utilizzarle liberamente e senza alcuna limitazione – ulteriori informazioni qui.
Declinazione di responsabilità
Le informazioni e le pubblicazioni non sono intese come, e non costituiscono, consulenza o raccomandazioni finanziarie, di investimento, di trading o di altro tipo fornite o approvate da TradingView. Per ulteriori informazioni, consultare i Termini di utilizzo.