PROTECTED SOURCE SCRIPT
Aggiornato QULLAMAGGIE Trades Database 2014-2022
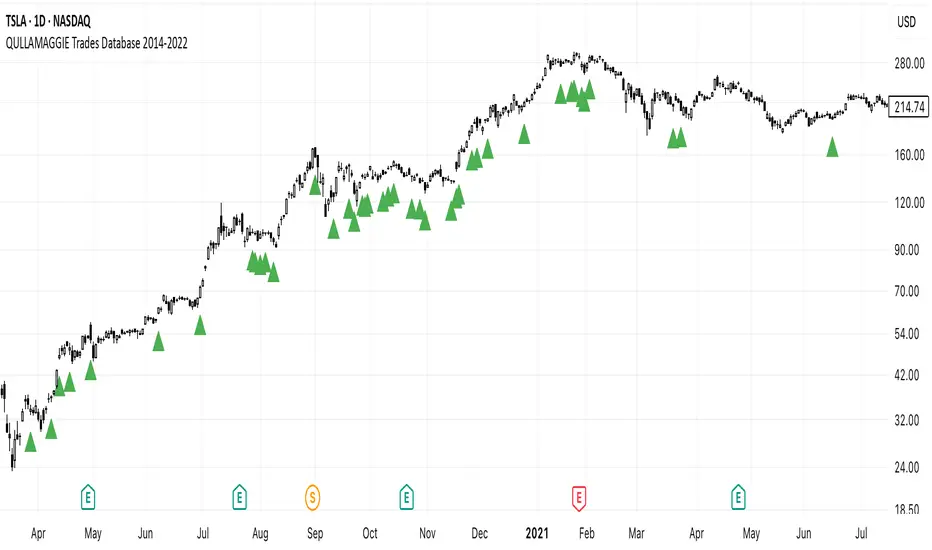
QULLAMAGGIE HISTORICAL TRADES DATABASE (2014-2022)
Educational research tool displaying historical entry points from documented trading activity.
═══════════════════════════════════════════
WHAT THIS IS:
- Visual database of 1,700+ historical trade entries
- Data compiled from publicly available livestream archives (2014-2022)
- Shows when trades were taken, not why or how they performed
- Educational reference for pattern recognition and timing study
⚠️ WORKS ON DAILY TIMEFRAME ONLY
This indicator is designed for daily charts. It will not display correctly on intraday timeframes (1min, 5min, 1h, etc.)
DATA SOURCES:
- Excel databases compiled from public archives
- Livestream recordings and tweet history
- Community-maintained trade logs
- Covers 554+ different tickers
WHAT THIS IS NOT:
❌ Not trade signals or recommendations
❌ Not showing entry prices, exits, stops, or position sizing
❌ Not guaranteed accurate or complete
❌ Past performance ≠ future results
❌ Does not work on intraday timeframes
INTENDED USE:
- Study historical timing patterns on daily charts
- Analyze market conditions when entries occurred
- Research setup frequency across different tickers
- Educational backtesting reference
LIMITATIONS:
- Shows only entry dates, not full trade management
- May contain transcription errors from original sources
- Historical data only - no predictive value
- Covers specific time period (2014-2022)
- Daily timeframe only
═══════════════════════════════════════════
FOR EDUCATIONAL AND RESEARCH PURPOSES ONLY
This indicator displays historical data compiled from public sources.
Not affiliated with or endorsed by the original trader.
Always do your own research and risk management.
Note di rilascio
QULLAMAGGIE HISTORICAL TRADES DATABASE (2014-2022)Educational research tool displaying historical entry points from documented trading activity.
═══════════════════════════════════════════
WHAT THIS IS:
- Visual database of 1,700+ historical trade entries
- Data compiled from publicly available livestream archives (2014-2022)
- Shows when trades were taken, not why or how they performed
- Educational reference for pattern recognition and timing study
⚠️ WORKS ON DAILY TIMEFRAME ONLY
This indicator is designed for daily charts. It will not display correctly on intraday timeframes (1min, 5min, 1h, etc.)
DATA SOURCES:
- Excel databases compiled from public archives
- Livestream recordings and tweet history
- Community-maintained trade logs
- Covers 554+ different tickers
WHAT THIS IS NOT:
❌ Not trade signals or recommendations
❌ Not showing entry prices, exits, stops, or position sizing
❌ Not guaranteed accurate or complete
❌ Past performance ≠ future results
❌ Does not work on intraday timeframes
INTENDED USE:
- Study historical timing patterns on daily charts
- Analyze market conditions when entries occurred
- Research setup frequency across different tickers
- Educational backtesting reference
LIMITATIONS:
- Shows only entry dates, not full trade management
- May contain transcription errors from original sources
- Historical data only - no predictive value
- Covers specific time period (2014-2022)
- Daily timeframe only
═══════════════════════════════════════════
FOR EDUCATIONAL AND RESEARCH PURPOSES ONLY
This indicator displays historical data compiled from public sources.
Not affiliated with or endorsed by the original trader.
Always do your own research and risk management.
Script protetto
Questo script è pubblicato come codice protetto. Tuttavia, è possibile utilizzarle liberamente e senza alcuna limitazione – ulteriori informazioni qui.
Declinazione di responsabilità
Le informazioni e le pubblicazioni non sono intese come, e non costituiscono, consulenza o raccomandazioni finanziarie, di investimento, di trading o di altro tipo fornite o approvate da TradingView. Per ulteriori informazioni, consultare i Termini di utilizzo.