PROTECTED SOURCE SCRIPT
Aggiornato Static Square & Cube Levels
Square & Cube Levels - Mathematical Price Support/Resistance
Description
This indicator plots horizontal lines at mathematically significant Square Numbers (1², 2², 3²...) and Cube Numbers (1³, 2³, 3³...) as static price levels on your chart. These mathematical levels often act as psychological support and resistance zones in financial markets.
Key Features
Square Levels: 1, 4, 9, 16, 25, 36, 49, 64, 81, 100...
Cube Levels: 1, 8, 27, 64, 125, 216, 343, 512...
Dual Configuration: Independent controls for squares and cubes
Customizable Colors: Different colors for square vs cube levels
Flexible Settings: Adjustable line width, style, and extension
Smart Labels: Clear identification of each level (e.g., "3² = 9", "4³ = 64")
Toggle Controls: Enable/disable squares or cubes independently
Use Cases
Support/Resistance Trading: Mathematical levels often act as psychological price barriers
Entry/Exit Points: Use levels for precise trade entries and profit targets
Price Analysis: Identify potential turning points at mathematically significant prices
Multi-Asset Trading: Works on any asset where these price levels are relevant
Settings
Square Levels: Max number (1-50), color, line width, labels on/off
Cube Levels: Max number (1-20), color, line width, labels on/off
Line Style: Solid, dashed, or dotted
Extension: None, left, right, or both directions
Best For
Stocks, forex pairs, and cryptocurrencies trading in ranges where these mathematical levels provide meaningful support/resistance zones. Particularly effective on assets with prices between $1-$1000 range.
Note: Cube numbers grow exponentially (1, 8, 27, 64, 125...), so adjust the maximum cube number based on your asset's price range for optimal visibility.
Note di rilascio
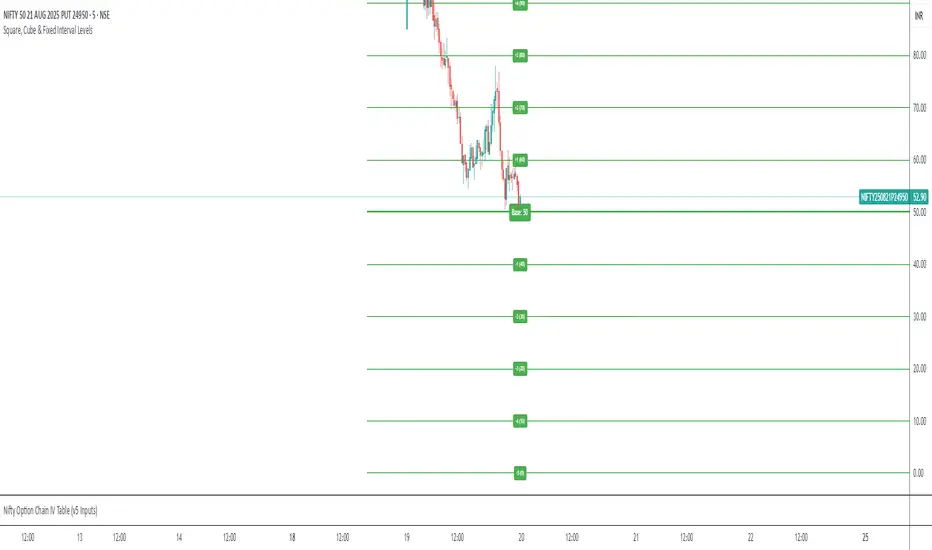
Square, Cube & Fixed Interval Levels - Complete Mathematical & Custom Price Level ToolDescription
This comprehensive indicator combines three powerful level systems in one tool: Mathematical Square Numbers, Cube Numbers, and Custom Fixed Interval lines. Draw static horizontal lines at mathematically significant levels plus your own custom price intervals for complete support/resistance analysis.
Features
Square Levels (1², 2², 3²...)
Static lines at: 1, 4, 9, 16, 25, 36, 49, 64, 81, 100...
Mathematical support/resistance levels
Customizable color, width, and labels
Cube Levels (1³, 2³, 3³...)
Static lines at: 1, 8, 27, 64, 125, 216, 343, 512...
Exponential mathematical levels
Independent styling from square levels
Fixed Interval Lines
Custom spacing from any base price you choose
Bidirectional: Set different numbers of lines above and below base
Perfect for: Round numbers ($10, $50, $100), options strikes, psychological levels
Example: Base $100, $25 intervals → Lines at $25, $50, $75, $100, $125, $150, $175...
Key Settings
Independent Controls: Enable/disable each system separately
Custom Colors: Different colors for squares, cubes, and intervals
Flexible Styling: Line width, style (solid/dashed/dotted), extension options
Smart Labels: Clear identification of each level type
Base Price Selection: Choose your reference point for interval lines
Custom Spacing: Any interval size (0.5, 10, 25, 100, etc.)
Use Cases
Support/Resistance Trading: Multiple level confirmation systems
Options Trading: Strike price intervals with mathematical levels
Psychological Levels: Round number analysis combined with mathematical zones
Multi-Timeframe Analysis: Static levels work across all timeframes
Entry/Exit Planning: Precise level-based trading strategies
Perfect For
All asset classes where these price levels provide meaningful reference points. Particularly effective for stocks ($1-$1000 range), forex major pairs, and cryptocurrency trading.
Pro Tip: Use different colors for each system - blue for squares, red for cubes, green for your custom intervals - for instant visual identification of level types.
Script protetto
Questo script è pubblicato come codice protetto. Tuttavia, è possibile utilizzarle liberamente e senza alcuna limitazione – ulteriori informazioni qui.
Declinazione di responsabilità
Le informazioni e le pubblicazioni non sono intese come, e non costituiscono, consulenza o raccomandazioni finanziarie, di investimento, di trading o di altro tipo fornite o approvate da TradingView. Per ulteriori informazioni, consultare i Termini di utilizzo.