PROTECTED SOURCE SCRIPT
Implied Volatility Test
Thought for 42sOverview of the "Implied Volatility Suite" Indicator
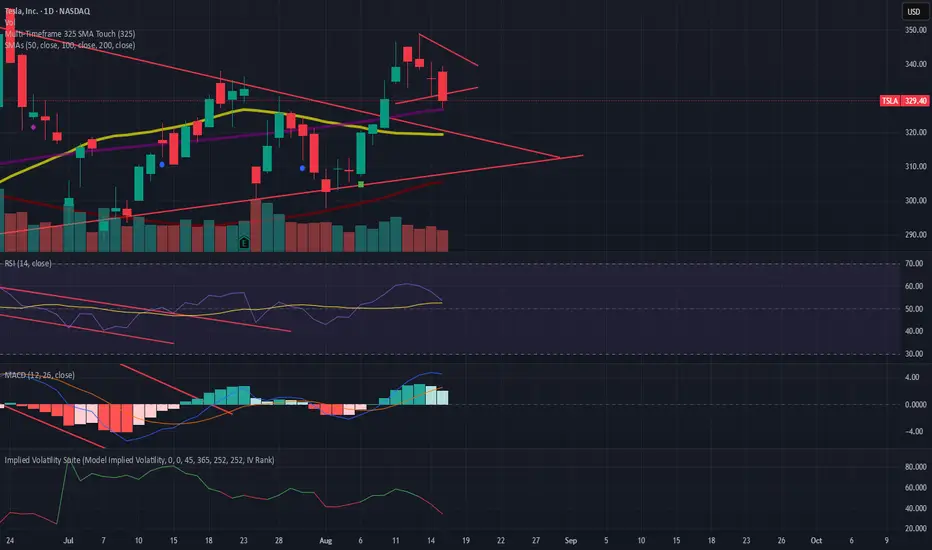
The "Implied Volatility Suite" is a custom TradingView indicator written in Pine Script (version 6) designed to estimate and visualize implied volatility (IV) for any stock or asset charted on TradingView. Unlike true implied volatility derived from options pricing (e.g., via Black-Scholes), this script provides a synthetic approximation based on historical price data. It offers flexibility by allowing users to choose between two calculation methods: "Model Implied Volatility" (a statistical projection based on log-normal assumptions) or "VixFix" (a historical volatility proxy inspired by Larry Williams' VIX Fix indicator). The output is plotted as an oscillating line, similar to the Relative Strength Index (RSI), making it easy to interpret overbought/oversold conditions or trends in volatility. Users can select what to plot: raw Implied Volatility, IV Rank, IV Percentile, or Volatility Skew Index, with color-coded visuals for quick analysis (e.g., red/green thresholds for ranks/percentiles).
This indicator is particularly useful for stocks without listed options, where real IV data isn't available, or for traders seeking a quick volatility gauge integrated into their charts.
What the Code Does
At its core, the script computes a volatility metric and transforms it into one of four plottable formats, then displays it as a line chart in a separate pane below the main price chart. Here's a breakdown:
User Inputs and Configuration:
Volatility Calculation Method: Choose "Model Implied Volatility" (default) or "VixFix".
Expiry Parameters (for Model method): Minutes, Hours, and Days until expiry (default 45 days). These are combined into Days (as a float for fractional days) and converted to years (Expiry = Days / 365).
Length Parameters: For Model IV rank/percentile (default 365), VixFix length (default 252, with recommendations like 9, 22, etc.), and VixFix rank/percentile length (default 252).
Output Choice: Select "Implied Volatility", "IV Rank", "IV Percentile" (default "IV Rank"), or "Volatility Skew Index".
The script uses spot = close as the reference price.
Core Calculations:
Model Implied Volatility:
Computes log returns: LogReturn = math.log(spot[1] / spot[2]) (percentage change between prior bars).
Calculates the simple moving average (Average) and standard deviation (STDEV) of log returns over an integer-rounded Days period.
Projects a time-adjusted mean (Time_Average = Days * Average) and standard deviation (Time_STDEV = STDEV * math.sqrt(Days)), assuming a random walk scaled by time.
Derives upper and lower bounds for the price at expiry: upper = spot * math.exp(Time_Average + 1 * Time_STDEV) and lower = spot * math.exp(Time_Average - 1 * Time_STDEV), representing a 1-standard-deviation range under log-normal distribution.
Computes the width of this range (width = upper - lower), halves it to get standard_dev, and annualizes it to sigma: sigma = standard_dev / (spot * math.sqrt(Expiry)).
Applies an "optimizer": If sigma > 1, halve it (to prevent unrealistically high values).
Result: IV (a decimal, e.g., 0.25 for 25% IV).
VixFix (Synthetic VIX Proxy):
Based on Larry Williams' VIX Fix formula, which estimates fear/volatility without options data: (ta.highest(spot, VIXFixLength) - low) / ta.highest(spot, VIXFixLength) * 100.
The script extends this for "upside" and "downside" by shifting the spot and low prices by multiples of standard deviation (0 for base VixFix).
VixFix is the average of upside(0) and downside(0), which are identical, yielding the standard VIX Fix value.
Volatility Skew Index:
Measures asymmetry in volatility (e.g., higher downside vol indicating fear).
For Model: Averages "upside IV" (calculated on spot shifted up by 1,2,3 * stdev) minus "downside IV" (shifted down).
For VixFix: Similar, but using shifted VIX Fix formulas for upside/downside.
Positive skew might indicate upside bias; negative indicates downside.
Rank and Percentile:
IV Rank: Normalizes the current volatility: (Volatility - ta.lowest(Volatility, Len)) / (ta.highest(Volatility, Len) - ta.lowest(Volatility, Len)) * 100.
IV Percentile: Uses ta.percentrank(Volatility, Len) to show what percentage of past values are below the current.
Len depends on the chosen method (e.g., 365 for Model).
Plotting and Visualization:
Selects VolatilityData based on user choice (e.g., IV * 100 for percentage display).
Applies colors: Red (<50) or green (>=50) for rank/percentile; aqua for skew; yellow for raw IV.
Plots as a line: plot(VolatilityData, color=col, title="Volatility Data").
The script switches logic seamlessly via conditionals (e.g., Volatility = VolCalc == "VixFix" ? VixFix : IV), ensuring the chosen method and output are used.
How It Works (Step-by-Step Execution Flow)
Initialization: Reads user inputs and sets spot = close. Computes Days (float) and DaysInt = math.round(Days) for integer lengths in TA functions.
Log Returns and Base Stats: For Model, calculates log returns, then SMA and STDEV over DaysInt.
Projection and IV Derivation: Scales stats to expiry time, computes bounds, derives sigma/IV.
Skew Functions: Defines reusable functions Model_Upside(i) and Model_Downside(i) (or VIX equivalents) to shift prices and recompute IV/VIX on shifted series.
Aggregation: Computes skew as average difference; sets Volatility to IV or VixFix.
Rank/Percentile/Skew: Applies over user-defined lengths.
Output Logic: Determines what to plot and its color based on VolatilityChoice.
Rendering: Plots the line in TradingView's indicator pane, updating bar-by-bar.
This leverages Pine Script's built-in functions like ta.sma, ta.stdev, ta.highest/lowest, and math.exp/log for efficiency.
Pros
Accessibility: Provides IV estimates for non-optionable assets (e.g., individual stocks, ETFs without options), filling a gap in TradingView's native tools.
Customization: Multiple methods (Model for forward-looking, VixFix for historical) and outputs (raw, ranked, percentile, skew) allow tailored analysis. Expiry adjustments make it suitable for options-like thinking.
Visual Simplicity: Oscillates like RSI (0-100 for ranks/percentiles), with intuitive colors, aiding quick decisions (e.g., high IV Rank might signal options selling opportunities).
No External Data Needed: Relies solely on chart data (close, low), making it lightweight and real-time.
Educational Value: Exposes users to volatility concepts like skew and log-normal projections, potentially improving trading strategies.
Flexibility in Timeframes: Works on any chart interval, with adjustable lengths for short-term (e.g., 9-bar VixFix) or long-term (365-day ranks).
Limitations
Not True Implied Volatility: This is a historical or model-based proxy, not derived from actual options prices. It may overestimate/underestimate real market-implied vol, especially during events (e.g., earnings) where options premium spikes unpredictably.
Assumptions in Model Method: Relies on log-normal distribution and constant volatility, ignoring fat tails, jumps, or mean reversion in real markets. The "optimizer" (halving sigma >1) is arbitrary and may distort results.
VixFix Variant Limitations: While based on a proven indicator, the upside/downside shifts (by stdev of prices, not returns) could be inaccurate for skew, as stdev(prices) doesn't scale properly with returns. It's backward-looking, not predictive like true IV.
Data Requirements: Needs sufficient historical bars (e.g., 365 for ranks), failing on new listings or short charts. Rounding Days to integer may introduce minor inaccuracies for fractional expiries.
Computational Intensity: Functions like repeated ta.stdev and shifts for skew (called multiple times per bar) could slow performance on long histories or low-power devices.
No Real-Time Options Integration: Doesn't pull live options data; users must manually compare to actual IV (e.g., via CBOE VIX for indices).
Potential for Misinterpretation: Oscillating line might mislead (e.g., high IV Rank doesn't always mean "sell vol"), and skew calculation is non-standard, requiring user expertise.
Version Dependency: Built for Pine v6 (as of 2025); future TradingView updates could break it, though it's straightforward to migrate.
Overall, this script is a valuable tool for volatility-aware trading but should be used alongside other indicators (e.g., ATR, Bollinger Bands) and validated against real options data when available. For improvements, consider backtesting its signals or integrating alerts for thresholds.1.9sHow can Grok help?
Script protetto
Questo script è pubblicato come codice protetto. Tuttavia, è possibile utilizzarle liberamente e senza alcuna limitazione – ulteriori informazioni qui.
Declinazione di responsabilità
Le informazioni e le pubblicazioni non sono intese come, e non costituiscono, consulenza o raccomandazioni finanziarie, di investimento, di trading o di altro tipo fornite o approvate da TradingView. Per ulteriori informazioni, consultare i Termini di utilizzo.