OPEN-SOURCE SCRIPT
DCF Approximation
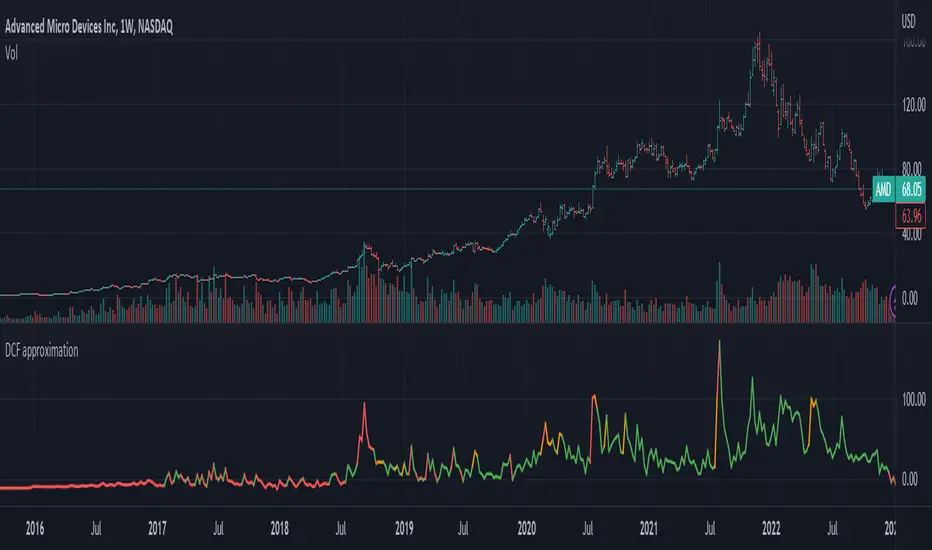
The indicator for calculating and visualizing the Discounted Cash Flow (DCF) for a selected stock.
It uses the Weighted Average Cost of Capital (WACC) with a margin of safety and the Free Cash Flow (FCF) calculation for cash flow analysis. The DCF is calculated by summing the discounted annual FCFs over a 10-year period.
The chart color depends on the value of the current price percentage - it turns red when the market price is over valuation, yellow around a fair value, and green for the price under valuation.
This is an early version of the indicator, so I would appreciate your suggestions for improving the code and formulas.
Script open-source
In pieno spirito TradingView, il creatore di questo script lo ha reso open-source, in modo che i trader possano esaminarlo e verificarne la funzionalità. Complimenti all'autore! Sebbene sia possibile utilizzarlo gratuitamente, ricorda che la ripubblicazione del codice è soggetta al nostro Regolamento.
Declinazione di responsabilità
Le informazioni ed i contenuti pubblicati non costituiscono in alcun modo una sollecitazione ad investire o ad operare nei mercati finanziari. Non sono inoltre fornite o supportate da TradingView. Maggiori dettagli nelle Condizioni d'uso.