Trendlines, Support, Resistance and Fibonacci With Alerts
I am Only Fibonacci.
I would like to give you detailed information about this indicator that I have prepared.
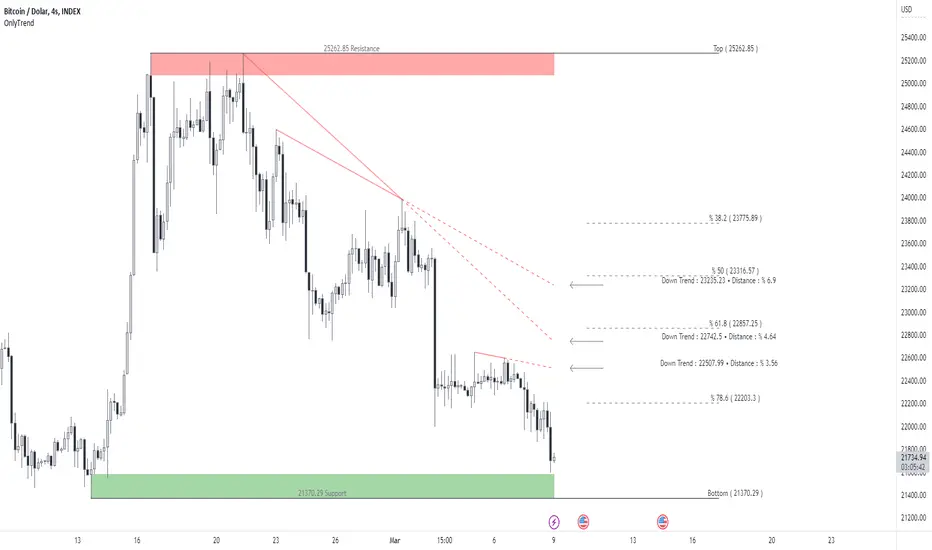
Within this indicator, you can see falling trends, rising trends, support and resistance, as well as Fibonacci levels.
I've prepared a few extra nice things for you. With this indicator, you can see the instant values of the active trend lines and their distance from the price. In my opinion, one of the best aspects of this indicator is that it can set alarms for automatically drawn trends. You can add alarms for both downtrend and uptrend.
The alarm is triggered at the break of the trend closest to the price.
Note: I do not recommend adding an alarm without thoroughly using the indicator.
We are now ready to introduce.
You can use this indicator in two languages. English and Turkish. The choice is yours.
When we enter the indicator settings, there is a group under the TRENDheading. With the settings in this group, you can determine the sensitivity of the trends to be plotted. The lower the sensitivity, the less reliable the plotted trends will be. I am sure you will find the middle ground.
Trends are calculated by relationships between all detected peaks.
If you check the Show Data box, you can see the value of the active (unbroken) trends in the current candle. Sometimes it can create visual pollution. So you can remove it. Below will be a version view where the values of the trendlines are not visible.
If you don't want to see the trends on the chart at all, uncheck the Show Trends box.
One of our subtitles is Fibonacci.
When you enter the number of bars that need to be checked backwards, it finds the highest and lowest levels in the past bars, and automatically draws fibonacci levels on the screen with a beautiful visual.
If you don't want to see Fibonacci on your chart, you can uncheck the Fibonacci Show box.
Our last topic is support and resistances.
We need a certain sensitivity setting to see support and resistance on the chart. The sensitivity setting will provide you with more realistic data. I am sure that you can adjust the correct settings in this regard as well. If you don't want to see any or both support or resistance on the chart, you can uncheck the Show Resistance or Show Support boxes.
Alarm
Active downtrends and rising trends are kept on the chart. If you want to be notified on the falling trend break closest to the price, you should choose DownTrend Breakdown.
If you want to be notified on the breakout of the rising trend closest to the price, you should choose UpTrend Breakdown.
Visuality
Downtrends are covered by a filled line between the two points. It continues with a dashed line from the second peak to the active candle. When the trend is broken, it disappears. It is red in color.
Uptrends are covered by a filled line between the two points. It continues with a dashed line from the second bottom to the active candle. When the trend is broken, it disappears. It is green in color.
The resistances are determined to cover the entire wick from the starting point to the active candle. It is red in color. It disappears when the resistance is broken.
Supports are determined to cover the entire wick from the starting point to the active candle. It is green in color. It disappears when the support is broken.
Use the link below to access this indicator.
The thickness of the trend lines can be adjusted.
The colors of the Fibonacci lines can be adjusted.
Added show/close Fibonacci lines options.
Colors of support and resistance can also be adjusted.
Text color editabled.
Added alarm to support and resistance breakouts.
It is under development.
Consider the information in the question mark next to the LOG sign.
Check LOG when you convert the graph to logarithmic.
Uncheck LOG when you convert to linear.
Script su invito
Solo gli utenti approvati dall'autore possono accedere a questo script. È necessario richiedere e ottenere l'autorizzazione per utilizzarlo. Tale autorizzazione viene solitamente concessa dopo il pagamento. Per ulteriori dettagli, seguire le istruzioni dell'autore riportate di seguito o contattare direttamente only_fibonacci.
TradingView NON consiglia di acquistare o utilizzare uno script a meno che non si abbia piena fiducia nel suo autore e se ne comprenda il funzionamento. È inoltre possibile trovare alternative gratuite e open source nei nostri script della community.
Istruzioni dell'autore
Declinazione di responsabilità
Script su invito
Solo gli utenti approvati dall'autore possono accedere a questo script. È necessario richiedere e ottenere l'autorizzazione per utilizzarlo. Tale autorizzazione viene solitamente concessa dopo il pagamento. Per ulteriori dettagli, seguire le istruzioni dell'autore riportate di seguito o contattare direttamente only_fibonacci.
TradingView NON consiglia di acquistare o utilizzare uno script a meno che non si abbia piena fiducia nel suo autore e se ne comprenda il funzionamento. È inoltre possibile trovare alternative gratuite e open source nei nostri script della community.