OPEN-SOURCE SCRIPT
WPR Volume Candle [Atareum]
AWPRVC (Atareum WPR Volume Candles) is clearly an awesome indicator produced by AtareumFX that is based on William’s Percent Range concepts by combination with volume. This is a new approach of volume candles that is combined with R% concepts and creates such a powerful tool to trace the market and assists traders to make better decisions surly and so much accurate. You can find this new indicator more useful because it has all benefits and advantages of William’s R% and cover its disadvantages. Also it is more powerful because of using volume in its calculations and generate a new candles which is more reliable and trustworthy.
Concept:
Using William’s Percent leading periods and calculations on redesigning new candles in combination with volume, that makes unique reform candles, but these new candles with their new cloud system clearly response to any reasonable price movement with so much information.
As you know if use R% there are some misleading fake signals generate by oscillator, also it could not show any sign of price moving trend which is almost confusing for beginners or even a pro trader! And finally this oscillator is so sensitive to price change that is so creepy to use for most of traders.
This new AWPRVC solve the problem and make all of them handy and useful for you.
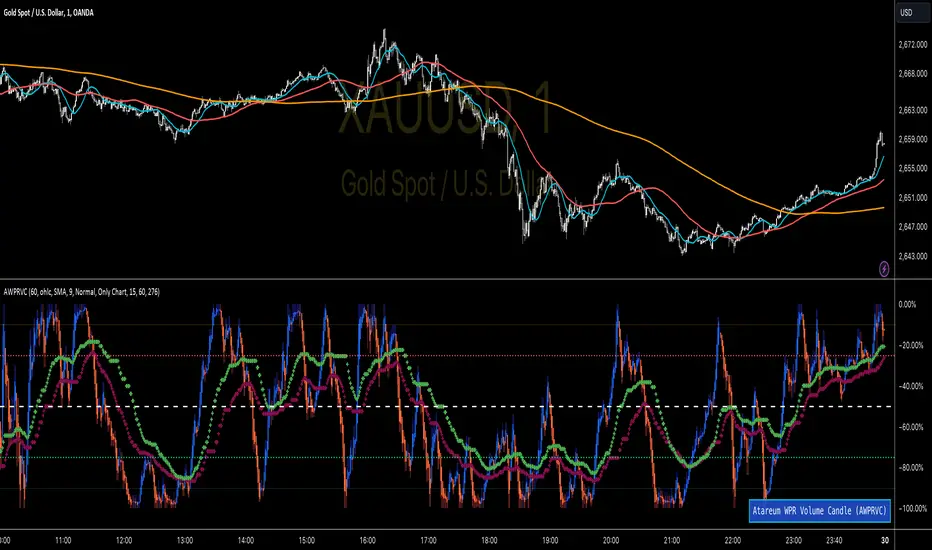
The cloud system which is designed in AWPRVC shows the price trend moving from Bearish Zone (-100 to -50 percent) to Bullish Zone (-50 to 0 percent). You can trust the lead moving forward of the clouds in two separate Top and Bottom (Bull and Bear) lines which solely determine the trend and power of price moving. When clouds are close to each other means we continue the trend and when they get far away from each other means we will face powerful trend in near future. If they are in Bearish Zone we continue the selling pressure and vice versa. Following picture shows good sample of Long and Short positions in compare with so many fake signals generated on original R%.
Besides the cloud system of AWPRVC which is clearly show the price trend and it is completely enough for being sure about price moving trend, you can use moving average which is designated in it to confirm the price trend, also.

Also you can see this new AWPRVC candle by using volume within its conformation, make reasonable price candles which is no so sensitive and so creepy and make your decisions come true in peace and clear sense of market moves. You can see following picture which is showing although the real price candles are so unclear and nonsense of making decision but the AWPRVC candles lead you to make true and trustable position.

As you see this new combination of Williams R% oscillator with volume and also generating a perfect new cloud system will clearly help traders even pro to trust the signals and understand whole market movement better and all of original problems of R% solved and even make a most powerful, trustworthy and useful new indicator.
Parameters:
Note: if you want to omit any or all of these moving averages, you can use 0 in period, instead of selecting "None" in the plot moving option!
Usage :
Overall:
Regardless of the additional moving averages which will lead to so many situations of market according to their types and designs, that is four different period for new redesign AWPRVC and three period for standard chart. You can easily select periods and type for these moving averages. Also, do not forget that signal moving averages is shown only on AWPRVC chart and have two different colour for upward and downward trends. Other moving averages are plot by just one single colour.
Cloud levels are so important because AWPRVC candles show respect to them and when they break the clouds upward or downward it is surly beginning of a trend. Do not forget we have 5 levels for tracing new AWPRVC candles move as follows : Ready for Short \ Long, Surly Short \ Long and Turn Trend which is in middle range of movement percent. Each level clearly shows what it means by its name.
Support and Resistance:
Any consolidation of AWPRVC candles in Ready for Short or Long Zones means the support or resistance level due to its nature, but important thing is how long the candles lasts in there or how many times repeated in the same level in AWPRVC chart zone in future.
For plotting the support or resistance you should trace range of AWPRVC candles consolidated and plot zone in standard chart candles just like following picture.

Divergence:
When standard price candles move downward but we see upward trend in clouds of AWPRVC candles that means we should face Bullish Trend because of the divergence and vice versa. You can see perfect example in following picture.

Signal:
Alert of Long :
Bullish candle cross both cloud down and up level simultaneously.
Confirmed Long :
AWPRVC candles cross up turn trend level and pullback to cloud up level.
Take profit of Long:
Any cross down of the AWPRVC candles from surly short level of chart.

Alert of Short :
Bearish candle cross both cloud up and down level simultaneously.
Confirmed Short :
AWPRVC candles cross down turn trend level and pullback to cloud down level.
Take profit of Short:
Any cross up of the AWPRVC candles from surly long level of chart.

Notes:
It is the result of many years of experience in markets and there are so many details about this AWPRVC chart which I am in the experiment phase to publish in the future, so please help me with your ideas and do not hesitate to comment and inform me any suggestions or criticism.
Concept:
Using William’s Percent leading periods and calculations on redesigning new candles in combination with volume, that makes unique reform candles, but these new candles with their new cloud system clearly response to any reasonable price movement with so much information.
As you know if use R% there are some misleading fake signals generate by oscillator, also it could not show any sign of price moving trend which is almost confusing for beginners or even a pro trader! And finally this oscillator is so sensitive to price change that is so creepy to use for most of traders.
This new AWPRVC solve the problem and make all of them handy and useful for you.
The cloud system which is designed in AWPRVC shows the price trend moving from Bearish Zone (-100 to -50 percent) to Bullish Zone (-50 to 0 percent). You can trust the lead moving forward of the clouds in two separate Top and Bottom (Bull and Bear) lines which solely determine the trend and power of price moving. When clouds are close to each other means we continue the trend and when they get far away from each other means we will face powerful trend in near future. If they are in Bearish Zone we continue the selling pressure and vice versa. Following picture shows good sample of Long and Short positions in compare with so many fake signals generated on original R%.
Besides the cloud system of AWPRVC which is clearly show the price trend and it is completely enough for being sure about price moving trend, you can use moving average which is designated in it to confirm the price trend, also.
Also you can see this new AWPRVC candle by using volume within its conformation, make reasonable price candles which is no so sensitive and so creepy and make your decisions come true in peace and clear sense of market moves. You can see following picture which is showing although the real price candles are so unclear and nonsense of making decision but the AWPRVC candles lead you to make true and trustable position.
As you see this new combination of Williams R% oscillator with volume and also generating a perfect new cloud system will clearly help traders even pro to trust the signals and understand whole market movement better and all of original problems of R% solved and even make a most powerful, trustworthy and useful new indicator.
Parameters:
- Section 1 : Candle colour setting for flourishing just as you desire !
- Section 2 : Defining Periods of R% and source of candle data in combination with determining the smoothing type of moving averages and signal period.
- Section 3 : Select using Standard candles alongside with redesigned cloud calculation type and three additional moving averages which can plot on each newly generated candles and standard candles on a chart with the type mode defined in the previous section.
Note: if you want to omit any or all of these moving averages, you can use 0 in period, instead of selecting "None" in the plot moving option!
Usage :
Overall:
Regardless of the additional moving averages which will lead to so many situations of market according to their types and designs, that is four different period for new redesign AWPRVC and three period for standard chart. You can easily select periods and type for these moving averages. Also, do not forget that signal moving averages is shown only on AWPRVC chart and have two different colour for upward and downward trends. Other moving averages are plot by just one single colour.
Cloud levels are so important because AWPRVC candles show respect to them and when they break the clouds upward or downward it is surly beginning of a trend. Do not forget we have 5 levels for tracing new AWPRVC candles move as follows : Ready for Short \ Long, Surly Short \ Long and Turn Trend which is in middle range of movement percent. Each level clearly shows what it means by its name.
Support and Resistance:
Any consolidation of AWPRVC candles in Ready for Short or Long Zones means the support or resistance level due to its nature, but important thing is how long the candles lasts in there or how many times repeated in the same level in AWPRVC chart zone in future.
For plotting the support or resistance you should trace range of AWPRVC candles consolidated and plot zone in standard chart candles just like following picture.
Divergence:
When standard price candles move downward but we see upward trend in clouds of AWPRVC candles that means we should face Bullish Trend because of the divergence and vice versa. You can see perfect example in following picture.
Signal:
Alert of Long :
Bullish candle cross both cloud down and up level simultaneously.
Confirmed Long :
AWPRVC candles cross up turn trend level and pullback to cloud up level.
Take profit of Long:
Any cross down of the AWPRVC candles from surly short level of chart.
Alert of Short :
Bearish candle cross both cloud up and down level simultaneously.
Confirmed Short :
AWPRVC candles cross down turn trend level and pullback to cloud down level.
Take profit of Short:
Any cross up of the AWPRVC candles from surly long level of chart.
Notes:
- Use moving averages cross of standard chart candles as lead to be in positions more as they are good representative of trend.
- As long as AWPRVC candles or Cloud levels are in Bullish Zone, you can stay in Long positions.
- Cloud level thickness means the power of trend and can be use as confirmation of powerful trend, so when cloud levels tight or going to cross each other it means the trend is going to be reversed.
It is the result of many years of experience in markets and there are so many details about this AWPRVC chart which I am in the experiment phase to publish in the future, so please help me with your ideas and do not hesitate to comment and inform me any suggestions or criticism.
Script open-source
Nello spirito di TradingView, l'autore di questo script lo ha reso open source, in modo che i trader possano esaminarne e verificarne la funzionalità. Complimenti all'autore! Sebbene sia possibile utilizzarlo gratuitamente, ricordiamo che la ripubblicazione del codice è soggetta al nostro Regolamento.
Declinazione di responsabilità
Le informazioni e le pubblicazioni non sono intese come, e non costituiscono, consulenza o raccomandazioni finanziarie, di investimento, di trading o di altro tipo fornite o approvate da TradingView. Per ulteriori informazioni, consultare i Termini di utilizzo.