PROTECTED SOURCE SCRIPT
Pulsepoint Multi-Session ORB Framework (Indicator Edition)
Pulsepoint Multi-Session ORB Framework (Indicator Edition)
Overview
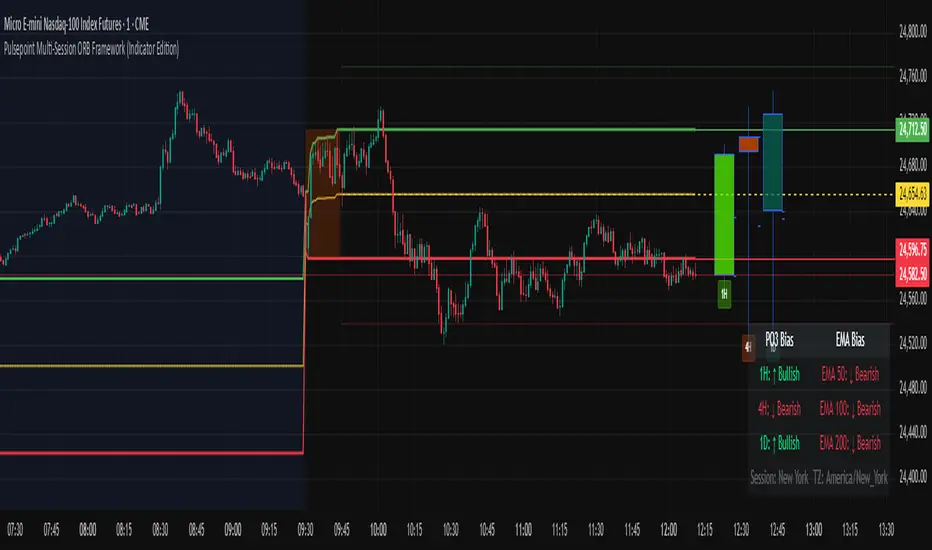
Pulsepoint ORB + PO3 Visual Framework is a visual-only indicator that combines a professional Opening Range (OR) visualization system with a multi-timeframe PO3 panel and bias dashboard.
It is built for traders who want clean market structure context of Opening Range Breakout.
Key Features
✅ Opening Range Box (High / Low / Midline) with optional target projections
✅ Multi-Timeframe PO3 Bars (e.g. 1H, 4H, 1D) plotted to the right of the chart
✅ Dynamic Coloring — bars automatically turn bullish or bearish based on open/close
✅ PO3 Bias Dashboard with real-time bias for each timeframe and EMA confluence (50, 100, 200)
✅ Session Presets & Custom OR Window (New York, London, Asia, Tokyo, or custom input)
✅ Live-Update Mode — choose between forming or closed HTF candles for your PO3 view
✅ Clean, Non-Intrusive Display — lightweight visual engine with optimized line/box count
Inputs & Options
Opening Range session preset or custom time window
OR visuals toggle (show/hide range box and target levels)
Custom colors for OR high/low/mid and PO3 up/down bars
Right-side offset, body width, wick thickness, opacity controls
Toggle equilibrium and open-line overlays on PO3 candles
Enable or disable the bias dashboard
Select whether PO3 bars use forming (real-time) or confirmed (closed) HTF candles
How to Use
Load the indicator on any chart and timeframe.
Choose your OR session preset or custom time window.
Adjust your three PO3 timeframes (e.g. 1H / 4H / 1D) to align with your style.
Observe the color alignment between PO3 bars and EMA bias dashboard to assess directional confluence.
Use as a contextual visual guide only — not for automatic entries or signals.
Best Practices
Use the PO3 framework to visualize price delivery, order flow, and multi-timeframe alignment.
Combine with your preferred tools such as volume profile, VWAP, or liquidity zones.
For strict HTF confirmation, disable “Use forming candles (live)” to color only after bar close.
Always confirm any trade idea with independent confluence and proper risk management.
Disclaimer
This indicator is published for educational and research purposes only.
It does not provide financial advice, buy/sell recommendations, or trade automation.
Trading involves substantial risk and may not be suitable for all investors.
Past performance does not guarantee future results.
By using this script, you agree that Pulsepoint Trader / Jeanex assumes no responsibility for any profits or losses incurred.
Version History
v1.0 – Initial release (ORB Box + PO3 Bars + Bias Dashboard)
v1.1 – Added dynamic PO3 coloring and live/closed HTF toggle
v1.2 – Added timeframe labels under each PO3 bar
v1.3 – UI refinements, dashboard polish, performance optimization
Author
Pulsepoint Trader © 2025
Professional Futures & Algorithmic Systems
Built for clarity, structure, and discipline in trading.
Overview
Pulsepoint ORB + PO3 Visual Framework is a visual-only indicator that combines a professional Opening Range (OR) visualization system with a multi-timeframe PO3 panel and bias dashboard.
It is built for traders who want clean market structure context of Opening Range Breakout.
Key Features
✅ Opening Range Box (High / Low / Midline) with optional target projections
✅ Multi-Timeframe PO3 Bars (e.g. 1H, 4H, 1D) plotted to the right of the chart
✅ Dynamic Coloring — bars automatically turn bullish or bearish based on open/close
✅ PO3 Bias Dashboard with real-time bias for each timeframe and EMA confluence (50, 100, 200)
✅ Session Presets & Custom OR Window (New York, London, Asia, Tokyo, or custom input)
✅ Live-Update Mode — choose between forming or closed HTF candles for your PO3 view
✅ Clean, Non-Intrusive Display — lightweight visual engine with optimized line/box count
Inputs & Options
Opening Range session preset or custom time window
OR visuals toggle (show/hide range box and target levels)
Custom colors for OR high/low/mid and PO3 up/down bars
Right-side offset, body width, wick thickness, opacity controls
Toggle equilibrium and open-line overlays on PO3 candles
Enable or disable the bias dashboard
Select whether PO3 bars use forming (real-time) or confirmed (closed) HTF candles
How to Use
Load the indicator on any chart and timeframe.
Choose your OR session preset or custom time window.
Adjust your three PO3 timeframes (e.g. 1H / 4H / 1D) to align with your style.
Observe the color alignment between PO3 bars and EMA bias dashboard to assess directional confluence.
Use as a contextual visual guide only — not for automatic entries or signals.
Best Practices
Use the PO3 framework to visualize price delivery, order flow, and multi-timeframe alignment.
Combine with your preferred tools such as volume profile, VWAP, or liquidity zones.
For strict HTF confirmation, disable “Use forming candles (live)” to color only after bar close.
Always confirm any trade idea with independent confluence and proper risk management.
Disclaimer
This indicator is published for educational and research purposes only.
It does not provide financial advice, buy/sell recommendations, or trade automation.
Trading involves substantial risk and may not be suitable for all investors.
Past performance does not guarantee future results.
By using this script, you agree that Pulsepoint Trader / Jeanex assumes no responsibility for any profits or losses incurred.
Version History
v1.0 – Initial release (ORB Box + PO3 Bars + Bias Dashboard)
v1.1 – Added dynamic PO3 coloring and live/closed HTF toggle
v1.2 – Added timeframe labels under each PO3 bar
v1.3 – UI refinements, dashboard polish, performance optimization
Author
Pulsepoint Trader © 2025
Professional Futures & Algorithmic Systems
Built for clarity, structure, and discipline in trading.
Script protetto
Questo script è pubblicato come codice protetto. Tuttavia, è possibile utilizzarlo liberamente e senza alcuna limitazione – per saperne di più clicca qui.
Declinazione di responsabilità
Le informazioni ed i contenuti pubblicati non costituiscono in alcun modo una sollecitazione ad investire o ad operare nei mercati finanziari. Non sono inoltre fornite o supportate da TradingView. Maggiori dettagli nelle Condizioni d'uso.