PROTECTED SOURCE SCRIPT
Simulated OI Proxy with Moving Average
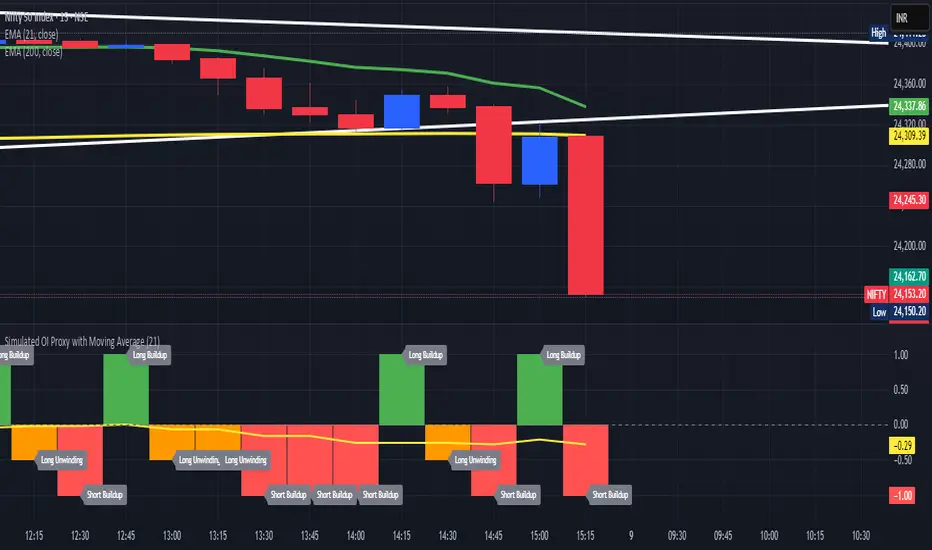
🧠 Simulated Open Interest (OI) Proxy with Moving Average
This custom TradingView indicator estimates market participation and positioning by simulating Open Interest (OI) using a proxy derived from price change and volume movement — useful especially when OI data is unavailable (e.g., NSE stocks or options).
📊 Concept & Logic:
Since TradingView doesn’t provide real OI data for many symbols (like Indian equities), this script uses a smart proxy:
✅ Simulated OI Conditions:
Long Buildup (Green bar):
Price is rising and volume is increasing → suggests fresh buying.
Short Buildup (Red bar):
Price is falling and volume is increasing → suggests new shorts are entering.
Short Covering (Blue bar):
Price is rising but volume is falling → suggests shorts are exiting positions.
Long Unwinding (Orange bar):
Price is falling and volume is dropping → suggests long positions are closing.
Neutral (Gray):
No strong directional signal.
Each condition is assigned a numeric value for analysis:
Long Buildup = +1
Short Buildup = -1
Short Covering = +0.5
Long Unwinding = -0.5
Neutral = 0
📈 Simulated OI Moving Average (Yellow Line):
To remove short-term noise, we apply a Simple Moving Average (SMA) over the simulated OI values (default: 21 periods). This line helps you:
Identify dominant positioning trends (bullish or bearish).
Use it as a signal filter in your trading strategies.
🔧 Customization:
OI MA Period: Adjust how smooth or reactive the moving average should be.
You can change the logic or combine this with EMA, RSI, or price action tools for a complete trading system.
🔍 Use Cases:
Traders in markets where real OI data is not available (like Indian stocks/options).
To analyze buildup and unwinding behavior without relying on exchange-fed OI.
As a momentum filter or signal enhancer in broader strategies.
📌 Note:
This is a proxy indicator, not a substitute for actual Open Interest. But it’s highly effective when used alongside price action and trend filters.
Script protetto
Questo script è pubblicato come codice protetto. Tuttavia, è possibile utilizzarle liberamente e senza alcuna limitazione – ulteriori informazioni qui.
Declinazione di responsabilità
Le informazioni e le pubblicazioni non sono intese come, e non costituiscono, consulenza o raccomandazioni finanziarie, di investimento, di trading o di altro tipo fornite o approvate da TradingView. Per ulteriori informazioni, consultare i Termini di utilizzo.