PROTECTED SOURCE SCRIPT
Aggiornato Lotus
This Pine Script is designed to plot multiple moving averages (SMA and EMA) on the chart, with dynamic color changes based on whether the price is above or below each moving average. The script includes customizable inputs for different SMA and EMA lengths, and each moving average has its own color scheme, which changes depending on the market price's position relative to the moving average.
Features:
Multiple Moving Averages:
SMA (Simple Moving Average) SELL: Configured with a default length of 22. This moving average is used for determining the "SELL" zone, and its color changes based on price action.
SMA (Simple Moving Average) CONTROL: Configured with a default length of 200. This moving average is a longer-term trend indicator used as a "control" reference. It’s color changes as well depending on price action.
SMA (Simple Moving Average) BUY: Configured with a default length of 50. This moving average acts as the "BUY" zone, where color changes help signal when price is above or below this moving average.
EMA (Exponential Moving Average): Configured with a default length of 13, which reacts more quickly to price changes compared to SMA. It’s plotted but hidden by default.
Dynamic Color Changes: Each moving average has two color states:
When the price is above the moving average, the color shifts to a positive tone, signaling potential buy signals.
When the price is below the moving average, the color turns negative, signaling potential sell or warning zones.
Colors used are:
SMA SELL: Green when above, Red when below.
SMA CONTROL: Blue when above, Red when below.
SMA BUY: Blue when above, Red when below.
EMA: Dark tone when above, Blue tone when below.
Customizable Inputs:
SMA 22 (SELL), SMA 200 (CONTROL), SMA 50 (BUY), and EMA 13 can be adjusted via the input panel to suit different trading strategies.
Source for calculations: The default source for all calculations is the close price.
Plotting and Visibility:
The SMA 22 and EMA 13 are hidden by default but can be revealed as per user preferences.
The SMA 200 and SMA 50 are visible by default for comparison.
How the Script Works:
Color Logic:
The moving averages are colored based on the position of the price relative to the moving average:
Green (Up trend): Price is above the moving average.
Red (Down trend): Price is below the moving average.
Blue (Neutral): For the SMA 50 and EMA, price is either neutral or ranging.
Dynamic Indicators:
The SMA SELL (22) helps traders spot short-term selling opportunities when the price is below this line.
The SMA CONTROL (200) helps gauge the long-term trend and acts as a control line.
The SMA BUY (50) is considered a neutral or buy zone, where the price is seen as more favorable for buying when above the line.
The EMA 13 reacts quickly to price changes, providing faster signals for traders looking for a more dynamic approach.
How to Use:
Trend Confirmation: Use the SMA 200 (Control line) for long-term trend confirmation.
Entry and Exit:
Buy: Look for price above the SMA 50 (BUY) and the SMA 22 (SELL) showing an uptrend.
Sell: Watch for price below the SMA 50 (BUY) or SMA 22 (SELL) indicating a possible downtrend or a selling opportunity.
EMA 13: Acts as a faster, more responsive trend indicator that can be used for shorter time-frame trades.
Example:
SMA SELL (22): The green line suggests potential buying opportunities when the price is above it. The red line suggests possible selling when the price is below.
SMA CONTROL (200): This acts as the primary trend indicator. If the price is above this, the long-term trend is bullish. If the price is below, the long-term trend is bearish.
SMA BUY (50): When the price is above this line, it indicates a favorable buying zone. When the price is below it, it suggests a potential bearish move.
EMA 13: Often used for short-term trades, especially when the price is moving quickly either above or below it.
Customization:
You can adjust the lengths of the SMA SELL, SMA CONTROL, SMA BUY, and EMA based on your personal strategy or trading style.
Modify the colors of each moving average line to better suit your chart preferences.
This script is suitable for traders looking to combine trend-following and short-term trading strategies using moving averages. It allows for an adaptable approach with visual cues based on the price's relationship with key moving averages.
Note di rilascio
01.05.2025Note di rilascio
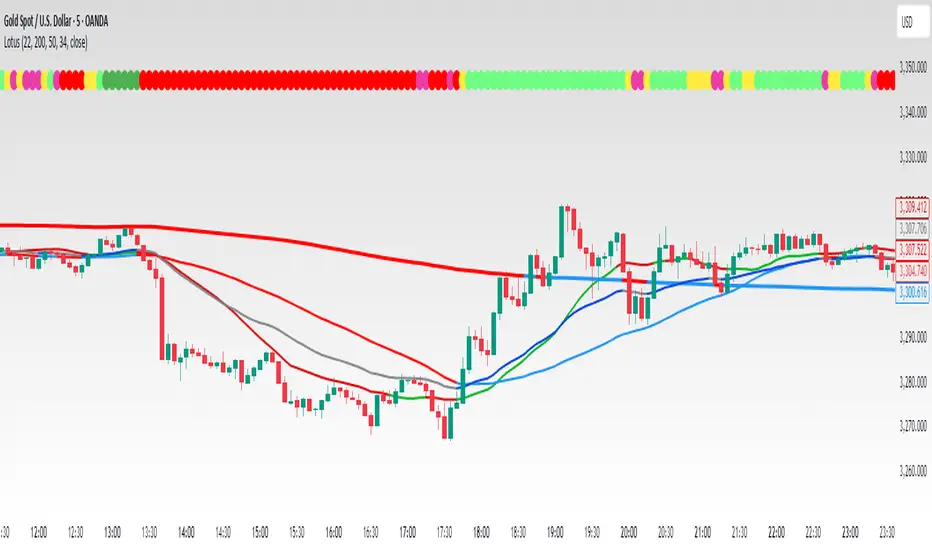
The Lotus Indicator is a simple yet powerful tool designed to visualize the overall market trend based on the direction of four key moving averages:SMA 22 (short-term trend)
SMA 50 (mid-term trend)
SMA 200 (long-term trend)
EMA 34 (short-term momentum)
🛠️ How it works:
It calculates the slope (upward or downward) of each moving average.
Depending on how many MAs are trending up or down, it displays a colored signal light on the chart.
🎨 Light Color Codes:
Green → All 4 moving averages are trending upward (strong uptrend)
Red → All 4 moving averages are trending downward (strong downtrend)
Pink → 3 moving averages are trending downward (bearish bias)
Light Green → 3 moving averages are trending upward (bullish bias)
Yellow → 2 moving averages are up, 2 are down (mixed/neutral trend)
🧠 Benefits:
Quickly assess overall trend strength without cluttering your chart.
Stay aligned with the dominant market direction.
Great for trend-following and avoiding false reversals.
✨ Notes:
You can customize the moving average lengths easily in the settings.
The color codes are adjustable if you want your own style.
Script protetto
Questo script è pubblicato come codice protetto. Tuttavia, è possibile utilizzarle liberamente e senza alcuna limitazione – ulteriori informazioni qui.
Declinazione di responsabilità
Le informazioni e le pubblicazioni non sono intese come, e non costituiscono, consulenza o raccomandazioni finanziarie, di investimento, di trading o di altro tipo fornite o approvate da TradingView. Per ulteriori informazioni, consultare i Termini di utilizzo.