PROTECTED SOURCE SCRIPT
Aggiornato ⚖ Volume BUYxSELL Pressure | by Octopu$
⚖ Volume BUYxSELL Pressure | by Octopu$
Volume is the number of shares traded in a particular stock, index, or other investment over a specific period of time.
It can indicate market strength, as rising markets on increasing volume are typically viewed as strong and healthy.
In fact, the more, the better. Institutions tend to get more involved in a stock with daily dollar volume in the hundreds of millions or more
But also, when prices fall on increasing volume, the trend is gathering strength to the downside.
That's where BUYxSELL Pressure | by Octopu$ comes in.
Typically, Volume bars follow the candles.
If the Candle is Green (Close > Open), the Volume Bar is also Green.
Now if the Candle is Red (Close < Open) the Volume Bar is also Red.
You never know if it is being Bought or Sold.
This changes the game: along with Price Action, Trend Direction, and other factors. This is possible!
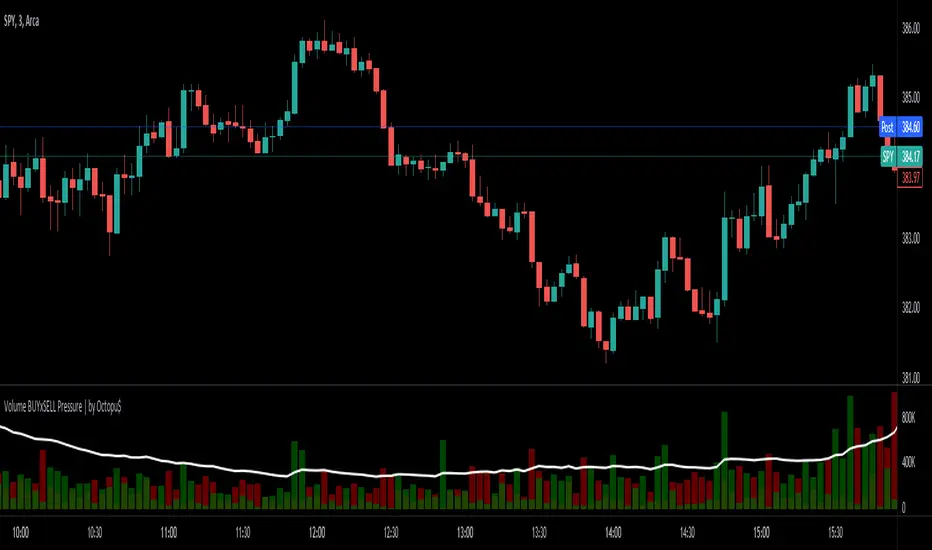
This indicator is composed of:
Volume itself (all of it), displayed by Gray bars;
Identifies Buying Pressure on Green Bars;
And Selling Pressure with Red Bars.
Volume Average as a White Line, for the last "X" Days
Additionally,
It presents a Yellow Triangle as and indication of when the Volume is above the Average in the current TF you are in.
Additionally, this can be set up via an Input: Means if you like to watch it 10% above Average, you got it. 25%? 50%?... You name it.
On top of that,
Includes an indication for Volume Spike as well. So if informs you visually on the Volume Bars of any surges on the TF you are in.
For example: 2x the Volume from the last Candle. Or maybe 3x? 5x... The way you like it the best.
This way, with the combination of your understanding as well as other Indicator and Factor as Confluence, you can improve your analysis and figure out what is going on.
tradingview.com/chart/CjeVgCt1/
(SPY 5m as an example only)
 SPY
SPY
Features:
• Total Volume
• Average Volume
• Buying Pressure
• Selling Pressure
• % Above Average
• Volume Spike/Surge (Multiplier)
• Custom Settings
Options:
• Show/Hide Average Line
• Change Length of Average (Days)
• Select/Personalize % of Above Avg
• Add Personalized X Multiplier
• Fully customizable on Style and Colors
• Change shapes and Location
Notes:
v1.0
Indicator release.
Changes and updates can come in the future for additional functionalities or per requests. Follow and Stay Tuned!
Did you like it? Please Support and Shoot me a message! I'd appreciate if you dropped by to say thanks! Thank you.
- Octopu$
🐙
Volume is the number of shares traded in a particular stock, index, or other investment over a specific period of time.
It can indicate market strength, as rising markets on increasing volume are typically viewed as strong and healthy.
In fact, the more, the better. Institutions tend to get more involved in a stock with daily dollar volume in the hundreds of millions or more
But also, when prices fall on increasing volume, the trend is gathering strength to the downside.
That's where BUYxSELL Pressure | by Octopu$ comes in.
Typically, Volume bars follow the candles.
If the Candle is Green (Close > Open), the Volume Bar is also Green.
Now if the Candle is Red (Close < Open) the Volume Bar is also Red.
You never know if it is being Bought or Sold.
This changes the game: along with Price Action, Trend Direction, and other factors. This is possible!
This indicator is composed of:
Volume itself (all of it), displayed by Gray bars;
Identifies Buying Pressure on Green Bars;
And Selling Pressure with Red Bars.
Volume Average as a White Line, for the last "X" Days
Additionally,
It presents a Yellow Triangle as and indication of when the Volume is above the Average in the current TF you are in.
Additionally, this can be set up via an Input: Means if you like to watch it 10% above Average, you got it. 25%? 50%?... You name it.
On top of that,
Includes an indication for Volume Spike as well. So if informs you visually on the Volume Bars of any surges on the TF you are in.
For example: 2x the Volume from the last Candle. Or maybe 3x? 5x... The way you like it the best.
This way, with the combination of your understanding as well as other Indicator and Factor as Confluence, you can improve your analysis and figure out what is going on.
tradingview.com/chart/CjeVgCt1/
(SPY 5m as an example only)
Features:
• Total Volume
• Average Volume
• Buying Pressure
• Selling Pressure
• % Above Average
• Volume Spike/Surge (Multiplier)
• Custom Settings
Options:
• Show/Hide Average Line
• Change Length of Average (Days)
• Select/Personalize % of Above Avg
• Add Personalized X Multiplier
• Fully customizable on Style and Colors
• Change shapes and Location
Notes:
v1.0
Indicator release.
Changes and updates can come in the future for additional functionalities or per requests. Follow and Stay Tuned!
Did you like it? Please Support and Shoot me a message! I'd appreciate if you dropped by to say thanks! Thank you.
- Octopu$
🐙
Note di rilascio
Update Information LocationNote di rilascio
Improve Calculation FormulaUpgrade to v5
Note di rilascio
Bars now pileCode clean up
Note di rilascio
Adjusted line width(no more overlap)
Note di rilascio
Added RVol(Relative Volume)
Script protetto
Questo script è pubblicato come codice protetto. Tuttavia, è possibile utilizzarle liberamente e senza alcuna limitazione – ulteriori informazioni qui.
🐙 Join me: bit.ly/JoinOctopuS
💰 Donate: bit.ly/ThankYouOctopuS
🐦 Twitter: twitter.com/OctopuSSSign
💰 Donate: bit.ly/ThankYouOctopuS
🐦 Twitter: twitter.com/OctopuSSSign
Declinazione di responsabilità
Le informazioni e le pubblicazioni non sono intese come, e non costituiscono, consulenza o raccomandazioni finanziarie, di investimento, di trading o di altro tipo fornite o approvate da TradingView. Per ulteriori informazioni, consultare i Termini di utilizzo.