[GrandAlgo] Supply Demand Pressure Cloud
In addition to pressure analysis, the indicator allows customization of zone strength—Major, Intermediate, or Minor—enabling users to adapt the tool to their trading strategy and preferred levels of significance.
Key Features:
- Unique Pressure Cloud Visualization:
Red Supply Clouds: Indicate areas with significant selling pressure, often acting as resistance.
Green Demand Clouds: Indicate areas with significant buying pressure, often acting as support.
The cloud shading dynamically represents the buildup of market pressure, providing a visual edge that simple supply/demand indicators lack. - Customizable Pressure Levels:
Choose between Mild, Moderate, or Strong pressure levels to highlight zones with varying levels of market intensity. - Adjustable Zone Strength:
Select between Major, Intermediate, and Minor zones to focus on the levels most relevant to your trading style. - Real-Time Adaptability:
Automatically adjusts to reflect the most current market conditions, ensuring the zones are always relevant. - Clear and Intuitive Visuals:
Gradual color shading for the Pressure Cloud enhances clarity and usability, making it easy to spot key levels at a glance. - Comprehensive Market Coverage:
Works seamlessly across multiple markets, including Forex, crypto, stocks, and commodities.
Why Choose Supply Demand Pressure Cloud?
While traditional supply and demand indicators only highlight zones, the Pressure Cloud adds another layer of actionable insight by visually representing the intensity of pressure within these areas. This feature allows traders to:
- Anticipate potential reversals with greater accuracy.
- Prioritize zones with higher market activity.
- Stay ahead of significant price movements.
The Pressure Cloud sets this indicator apart, making it an essential tool for traders who want a deeper understanding of market dynamics.
How It Works:
The Supply Demand Pressure Cloud identifies supply and demand zones by analyzing historical price data. It then overlays a Pressure Cloud within these zones, representing the intensity of pressure. Users can further refine the analysis by:
- Selecting Pressure Levels:
🔹 Mild: Highlights pressure clouds with lower intensity.
🔹 Moderate: Displays pressure clouds with medium intensity.
🔹 Strong: Focuses on pressure clouds with the highest intensity for precise trading insights.decisions. - Adjusting Zone Strength:
🔹 Major: High-impact zones that attract significant market attention.
🔹 Intermediate: Medium-significance levels for additional context.
🔹 Minor: Lesser impact zones for detailed analysis.
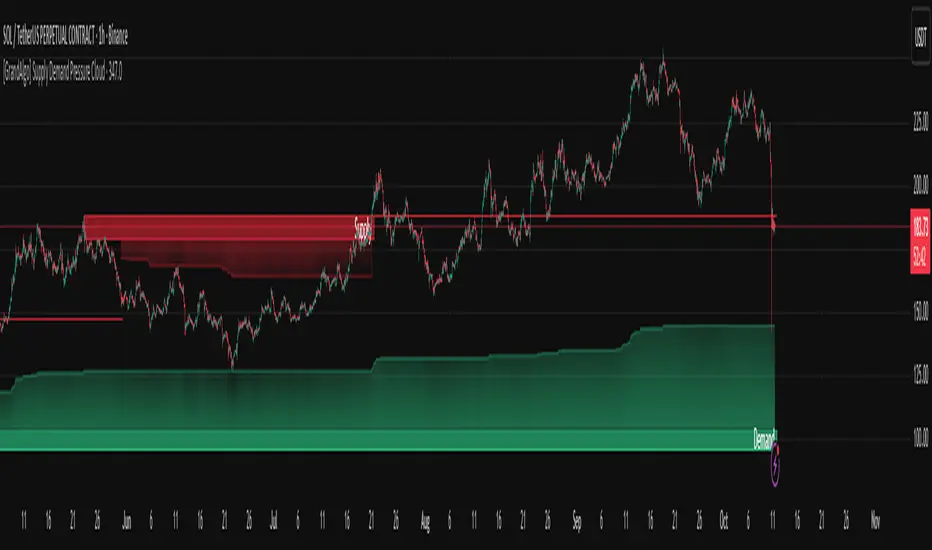
The image showcases the Supply Demand Pressure Cloud in action, dynamically highlighting key supply and demand zones on the chart. These zones, combined with the pressure clouds, provide a clear visualization of potential areas of market interest:
Supply Zone (Red): Represents areas of concentrated selling pressure. The overlayed Supply Cloud (red gradient) highlights the buildup of supply pressure within the zone, offering insights into potential resistance areas.
Demand Zone (Green): Represents areas of concentrated buying pressure. The overlayed Demand Cloud (green gradient) highlights the buildup of demand pressure, indicating potential support zones.
This powerful combination of zones and pressure clouds equips traders with actionable insights to identify market turning points, reversals, and areas of consolidation. Let the Supply Demand Pressure Cloud be your guide to navigating market dynamics.
Disclaimer:
This indicator is a technical analysis tool designed to assist traders by providing insights into market conditions. It does not guarantee future price movements or trading outcomes and should not be relied upon as a sole decision-making tool. The effectiveness of this indicator depends on its application, which requires your trading knowledge, experience, and judgment.
Trading involves significant financial risk, including the potential loss of capital. Past performance of any tool or indicator does not guarantee future results. This script is intended for educational and informational purposes only and does not constitute financial or investment advice. Users are strongly encouraged to perform their own analysis and consult with a qualified financial professional before making trading decisions.
Script su invito
Solo gli utenti approvati dall'autore possono accedere a questo script. È necessario richiedere e ottenere l'autorizzazione per utilizzarlo. Tale autorizzazione viene solitamente concessa dopo il pagamento. Per ulteriori dettagli, seguire le istruzioni dell'autore riportate di seguito o contattare direttamente GrandAlgo.
TradingView NON consiglia di acquistare o utilizzare uno script a meno che non si abbia piena fiducia nel suo autore e se ne comprenda il funzionamento. È inoltre possibile trovare alternative gratuite e open source nei nostri script della community.
Istruzioni dell'autore
Declinazione di responsabilità
Script su invito
Solo gli utenti approvati dall'autore possono accedere a questo script. È necessario richiedere e ottenere l'autorizzazione per utilizzarlo. Tale autorizzazione viene solitamente concessa dopo il pagamento. Per ulteriori dettagli, seguire le istruzioni dell'autore riportate di seguito o contattare direttamente GrandAlgo.
TradingView NON consiglia di acquistare o utilizzare uno script a meno che non si abbia piena fiducia nel suo autore e se ne comprenda il funzionamento. È inoltre possibile trovare alternative gratuite e open source nei nostri script della community.