OPEN-SOURCE SCRIPT
MACD Histogram Multi-Timeframe
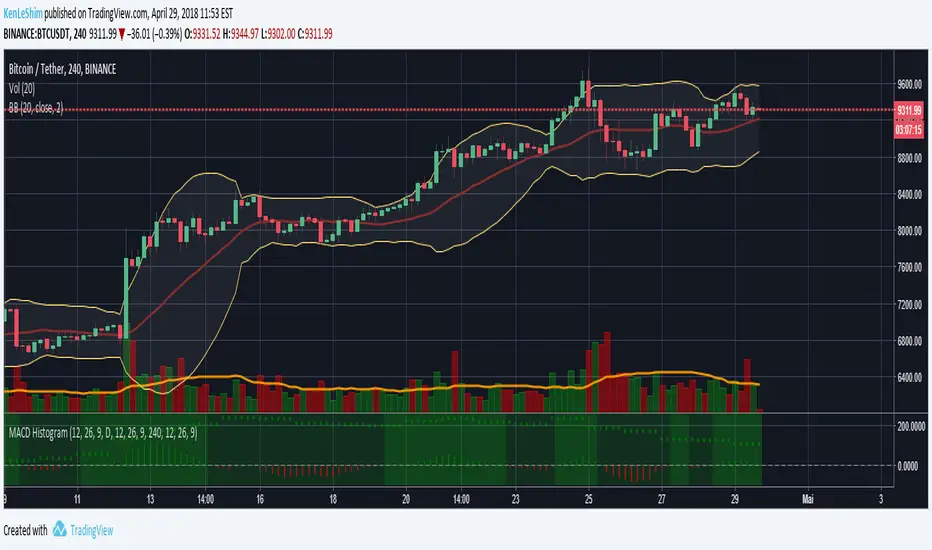
The MACD-Histogram represents the difference between the MACD (i.e., the between the two EMAs) and the signal line (i.e., the 9-day EMA of the MACD). The histogram is positive (i.e., above the zero line) when the MACD is above the signal line and negative when the MACD is below the signal line.
HOW IS IT USED ?
A bullish crossover occurs when the MACD histogram is negative and a bearish cross over occurs when the MACD histogram is negative.
I added the possibility to add on the chart a 2nd timeframe for confirmation.
If you found this script useful, a tip is always welcome... :)
HOW IS IT USED ?
A bullish crossover occurs when the MACD histogram is negative and a bearish cross over occurs when the MACD histogram is negative.
I added the possibility to add on the chart a 2nd timeframe for confirmation.
If you found this script useful, a tip is always welcome... :)
Script open-source
Nello spirito di TradingView, l'autore di questo script lo ha reso open source, in modo che i trader possano esaminarne e verificarne la funzionalità. Complimenti all'autore! Sebbene sia possibile utilizzarlo gratuitamente, ricordiamo che la ripubblicazione del codice è soggetta al nostro Regolamento.
Declinazione di responsabilità
Le informazioni e le pubblicazioni non sono intese come, e non costituiscono, consulenza o raccomandazioni finanziarie, di investimento, di trading o di altro tipo fornite o approvate da TradingView. Per ulteriori informazioni, consultare i Termini di utilizzo.