OPEN-SOURCE SCRIPT
Aggiornato USD Market Liquidity [tedtalksmacro]
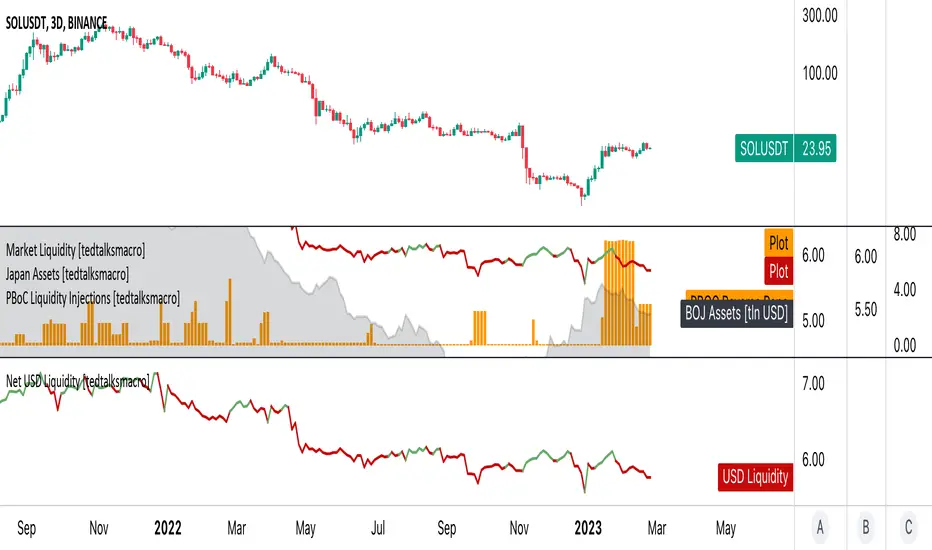
This script aggregates and analyses total USD market liquidity in trillions of dollars - albeit with lagged, weekly data (live data is not available in TradingView!)
There's a positive correlation with the total liquidity available in the world's largest economy and risk assets like BTCUSD
The formula for net liquidity is as follows and uses account balances at the Fed and of the Treasury's General Account:
Fed Balance Sheet USBBS — Accepted Reverse Repo Bids RRPONTTLD — Treasury General Account Balance WTREGEN
This script shows positive prints when liquidity is above it's 7 day EMA and negative when below... don't use this on timeframes lower than the 1D chart!
There's a positive correlation with the total liquidity available in the world's largest economy and risk assets like
The formula for net liquidity is as follows and uses account balances at the Fed and of the Treasury's General Account:
Fed Balance Sheet
This script shows positive prints when liquidity is above it's 7 day EMA and negative when below... don't use this on timeframes lower than the 1D chart!
Note di rilascio
Overlay changed to false.Note di rilascio
name updatedNote di rilascio
plot titles updatedScript open-source
Nello spirito di TradingView, l'autore di questo script lo ha reso open source, in modo che i trader possano esaminarne e verificarne la funzionalità. Complimenti all'autore! Sebbene sia possibile utilizzarlo gratuitamente, ricordiamo che la ripubblicazione del codice è soggetta al nostro Regolamento.
Declinazione di responsabilità
Le informazioni e le pubblicazioni non sono intese come, e non costituiscono, consulenza o raccomandazioni finanziarie, di investimento, di trading o di altro tipo fornite o approvate da TradingView. Per ulteriori informazioni, consultare i Termini di utilizzo.
Script open-source
Nello spirito di TradingView, l'autore di questo script lo ha reso open source, in modo che i trader possano esaminarne e verificarne la funzionalità. Complimenti all'autore! Sebbene sia possibile utilizzarlo gratuitamente, ricordiamo che la ripubblicazione del codice è soggetta al nostro Regolamento.
Declinazione di responsabilità
Le informazioni e le pubblicazioni non sono intese come, e non costituiscono, consulenza o raccomandazioni finanziarie, di investimento, di trading o di altro tipo fornite o approvate da TradingView. Per ulteriori informazioni, consultare i Termini di utilizzo.