OPEN-SOURCE SCRIPT
Chart CAGR
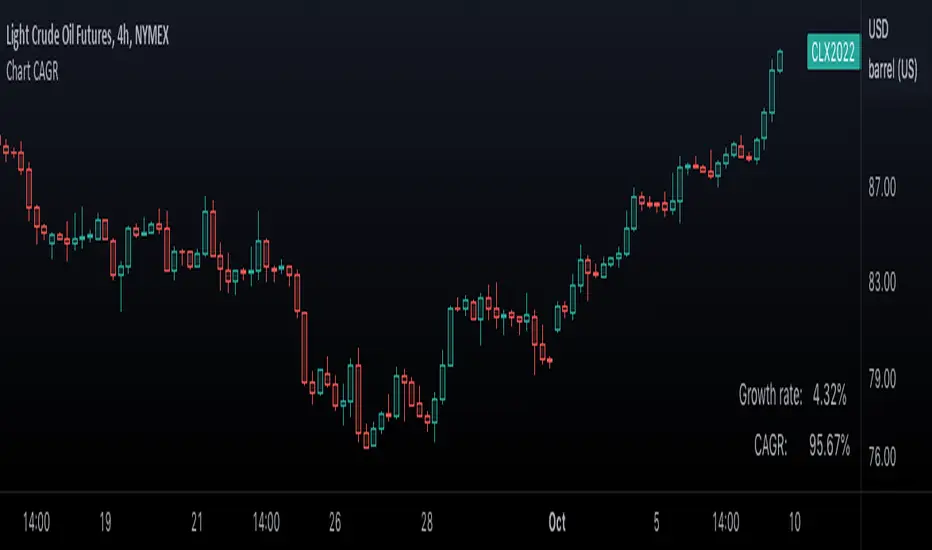
█ OVERVIEW
This simple script displays in the lower-right corner of the chart the Growth Rate and the Compound Annual Growth Rate (CAGR) between the open of the chart's first visible bar and the close of its last bar. As you zoom/scroll the chart, calculations will adjust to the chart's bars. You can change the location and colors of the displayed text in the script's settings.
If you need to calculate the CAGR between any two points on the chart, see our CAGR Custom Range indicator.
█ FOR Pine Script™ CODERS
Like our Chart VWAP publication, this script calculates on the range of visible bars utilizing the new Pine Script™ functions announced here and the VisibleChart library by PineCoders. It also uses the `cagr()` function from our ta library, which was recently augmented with many new functions.
Look first. Then leap.
Script open-source
In pieno spirito TradingView, il creatore di questo script lo ha reso open-source, in modo che i trader possano esaminarlo e verificarne la funzionalità. Complimenti all'autore! Sebbene sia possibile utilizzarlo gratuitamente, ricorda che la ripubblicazione del codice è soggetta al nostro Regolamento.
Share TradingView with a friend:
tradingview.com/share-your-love/
Read more about the new tools and features we're building for you: tradingview.com/blog/en/
tradingview.com/share-your-love/
Read more about the new tools and features we're building for you: tradingview.com/blog/en/
Declinazione di responsabilità
Le informazioni ed i contenuti pubblicati non costituiscono in alcun modo una sollecitazione ad investire o ad operare nei mercati finanziari. Non sono inoltre fornite o supportate da TradingView. Maggiori dettagli nelle Condizioni d'uso.