PROTECTED SOURCE SCRIPT
Aggiornato Financial Conditions Indicator (FCI)
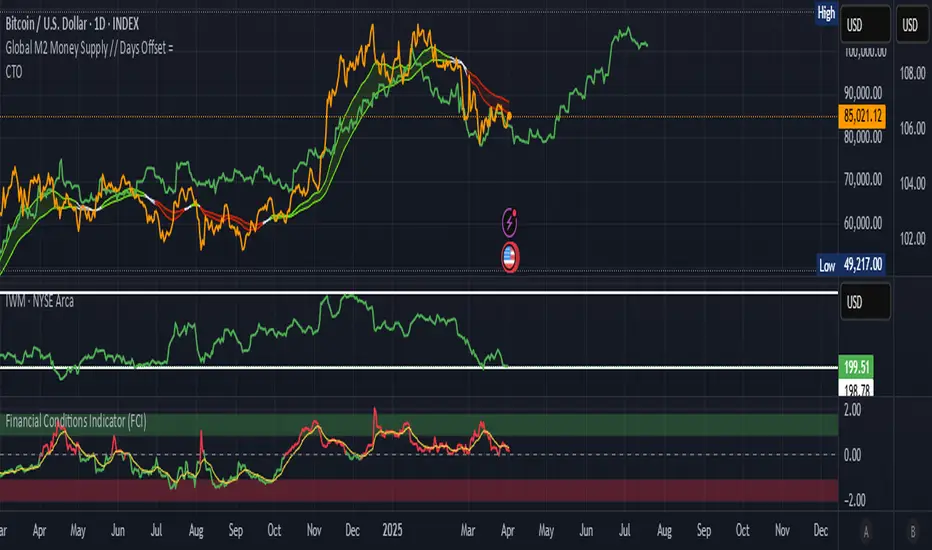
The Financial Conditions Indicator (FCI) is a composite tool designed to help traders evaluate the tightness or looseness of financial conditions in the U.S. market. It aggregates four key metrics—VIX (stock market volatility), high-yield bond spreads (proxied by HYG), corporate bond spreads (proxied by LQD), and Treasury market volatility (proxied by MOVE)—into a single Z-score-based index. This indicator provides a visual representation of market stress and can assist in analyzing potential economic and asset price trends.
Key Features:
How to Use:
Applications:
Example Scenarios:
Tight Conditions (Red Plot): A rising FCI above 0 might warn of increasing market stress, potentially signaling a pullback in equities or a spike in volatility. Traders could reduce risk exposure.
Loose Conditions (Green Plot): A falling FCI below 0 may indicate favorable conditions for risk assets, suggesting opportunities to increase equity or high-yield exposure.
EMA Signals: A Z-score crossing above the EMA could hint at worsening conditions, while a cross below might suggest improvement.
Note: This indicator is provided for informational purposes only and does not offer financial advice. Users should perform their own analysis and consider multiple factors before trading.
Key Features:
- Composite Z-Score: Combines standardized Z-scores of VIX, HYG, LQD, and MOVE into a unified measure of financial conditions.
- Color-Coded Output: Plots in red when conditions are tight (Z-score > 0) and green when conditions are loose (Z-score < 0).
- 10-Day EMA Overlay: Includes a 10-day exponential moving average (EMA) of the composite Z-score to highlight short-term trends.
- Customizable Parameters: Allows users to adjust the Z-score lookback period and EMA length for flexibility.
How to Use:
- Add to Chart: Find "Financial Conditions Indicator (FCI)" in the Indicators menu and apply it to your chart.
- Customize Settings (Optional):
Lookback Period (Days): Sets the period for Z-score calculations (default: 160 days).
EMA Length (Days): Adjusts the EMA period (default: 10 days). - Interpret the Results:
- Red Line (Z-Score > 0): Indicates tight financial conditions, often tied to higher volatility and wider credit spreads.
- Green Line (Z-Score < 0): Suggests loose conditions, typically associated with lower volatility and tighter spreads.
- Yellow Line (10-Day EMA): Tracks the short-term direction of financial conditions; crossovers with the Z-score may signal shifts.
- Red Line (Z-Score > 0): Indicates tight financial conditions, often tied to higher volatility and wider credit spreads.
Applications:
- Monitor market stress levels to anticipate volatility or asset price movements.
- Use as a risk management tool for adjusting exposure in risk-on/risk-off strategies.
- Analyze potential economic turning points based on financial condition trends.
- Data Dependency: Requires at least 160 days of historical data (or the selected lookback period) for accurate Z-score computation.
- U.S.-Centric Design: Tailored to U.S. financial markets; applicability to other regions may vary.
- Supplementary Tool: Best used with other analysis methods, not as a standalone trading signal.
Example Scenarios:
Tight Conditions (Red Plot): A rising FCI above 0 might warn of increasing market stress, potentially signaling a pullback in equities or a spike in volatility. Traders could reduce risk exposure.
Loose Conditions (Green Plot): A falling FCI below 0 may indicate favorable conditions for risk assets, suggesting opportunities to increase equity or high-yield exposure.
EMA Signals: A Z-score crossing above the EMA could hint at worsening conditions, while a cross below might suggest improvement.
Note: This indicator is provided for informational purposes only and does not offer financial advice. Users should perform their own analysis and consider multiple factors before trading.
Note di rilascio
Enhanced plotting and added some config options.Note di rilascio
Minor fixesScript protetto
Questo script è pubblicato come codice protetto. Tuttavia, è possibile utilizzarle liberamente e senza alcuna limitazione – ulteriori informazioni qui.
Declinazione di responsabilità
Le informazioni e le pubblicazioni non sono intese come, e non costituiscono, consulenza o raccomandazioni finanziarie, di investimento, di trading o di altro tipo fornite o approvate da TradingView. Per ulteriori informazioni, consultare i Termini di utilizzo.
Script protetto
Questo script è pubblicato come codice protetto. Tuttavia, è possibile utilizzarle liberamente e senza alcuna limitazione – ulteriori informazioni qui.
Declinazione di responsabilità
Le informazioni e le pubblicazioni non sono intese come, e non costituiscono, consulenza o raccomandazioni finanziarie, di investimento, di trading o di altro tipo fornite o approvate da TradingView. Per ulteriori informazioni, consultare i Termini di utilizzo.