OPEN-SOURCE SCRIPT
Price Sandwich
For the script in question
This script acts as an indicator that a potential short term or long term trend reversal is coming. Note that not every candle can be used as an indication and the smaller ones tend to have little to no effect, however they can be used alongside orderblocks or future support/resistance areas.
The best timeframes I've found these to be useable are on the 1m, 2m, or second charts.
You may use this as an added confluence that a trend is ending either short term or long term.
You may also decide to use this with other indicators to build further confluence.
Note that this is just something I've noticed personally most likely does not apply to all trend reversals.
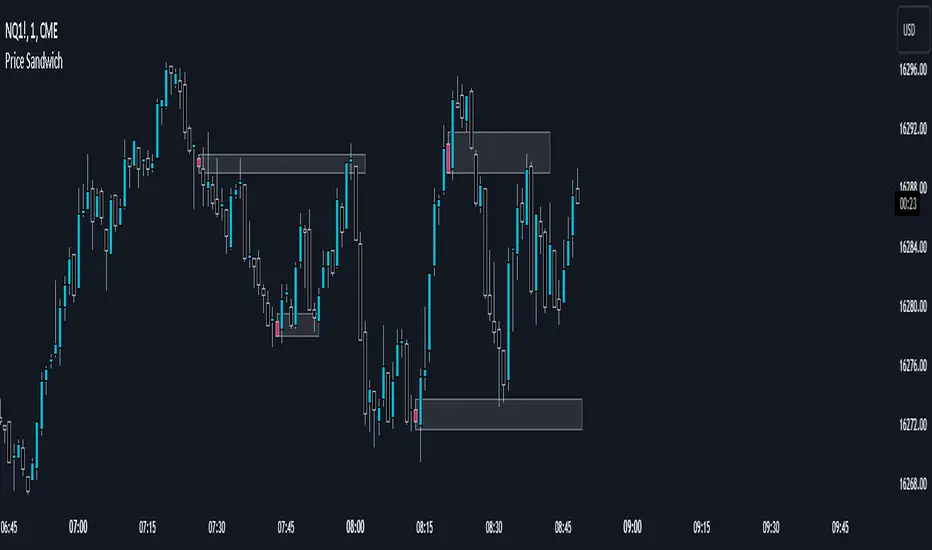
Some ideas on how to use it:
If you extend a rectangle out from the block itself, you can often find the next high or low overlaps with said rectangle.
They may also overlap with a fair value gap that could make that gap have more potential.
Hope this is of use and can help with that added confluence or early warning signal of a potential reversal. This should not be used alone and it's recommended to not use this as a surefire indication of whether to take a trade.//Krindler
Script Breakdown
//version=5 // this makes the script v5 friendly
indicator("Price Sandwich", overlay=true) //makes this script an indicator, overlay=true to make it a part of the main chart
// User input for the highlight color
userColor = input(color.green, title="Highlight Color") //This allows you to choose what color you want the candle to be in the settings
//Function to check the custom candle pattern based on whether the candle is being englulfed by both preceding and latter candle.
isCustomPattern() => //let's me look for a custom candle pattern
high[2] > high[1] and high[1] < high[0] and low[2] < low[1] and low[1] > low[0]
//this checks the candle before and the candle after to check that the candle in the middle doesn't escape the range of the candle before, or the candle afters highs and lows thus making it a sandwiched candle.
//high[2] > high[1] and high[1] < high[0] and low[2] < low[1] and low[1] > low[0] basically says: candle 1 high must be greater than candle 2 high and candle 2 high must be less than candle 3 high and candle 1 low must be less than candle 2 low and candle 2 low must be greater than candle 3 low. Thus making sure that candle 2 is within the range of candle's 1 and 3 and doesn't have a high or low that is either above or below candle 1 and 3. 'and' is the operator to make sure that all of these values must be true in order for that candle to meet the criteria of getting colored.
// Apply bar color to Sandwiched candle if candle is found.
barcolor(isCustomPattern() ? userColor : na, offset=-1) //this targets the findings from isCustomPattern() and uses the user color chosen in settings and colors the middle bar by using offset=-1, otherwise it would color candle 3, so offset goes back 1 candle to color the middle candle.
If this script is already in circulation, please let me know and i'll remove it immediately. I checked but couldn't find one that did it.
This script acts as an indicator that a potential short term or long term trend reversal is coming. Note that not every candle can be used as an indication and the smaller ones tend to have little to no effect, however they can be used alongside orderblocks or future support/resistance areas.
The best timeframes I've found these to be useable are on the 1m, 2m, or second charts.
You may use this as an added confluence that a trend is ending either short term or long term.
You may also decide to use this with other indicators to build further confluence.
Note that this is just something I've noticed personally most likely does not apply to all trend reversals.
Some ideas on how to use it:
If you extend a rectangle out from the block itself, you can often find the next high or low overlaps with said rectangle.
They may also overlap with a fair value gap that could make that gap have more potential.
Hope this is of use and can help with that added confluence or early warning signal of a potential reversal. This should not be used alone and it's recommended to not use this as a surefire indication of whether to take a trade.//Krindler
Script Breakdown
//version=5 // this makes the script v5 friendly
indicator("Price Sandwich", overlay=true) //makes this script an indicator, overlay=true to make it a part of the main chart
// User input for the highlight color
userColor = input(color.green, title="Highlight Color") //This allows you to choose what color you want the candle to be in the settings
//Function to check the custom candle pattern based on whether the candle is being englulfed by both preceding and latter candle.
isCustomPattern() => //let's me look for a custom candle pattern
high[2] > high[1] and high[1] < high[0] and low[2] < low[1] and low[1] > low[0]
//this checks the candle before and the candle after to check that the candle in the middle doesn't escape the range of the candle before, or the candle afters highs and lows thus making it a sandwiched candle.
//high[2] > high[1] and high[1] < high[0] and low[2] < low[1] and low[1] > low[0] basically says: candle 1 high must be greater than candle 2 high and candle 2 high must be less than candle 3 high and candle 1 low must be less than candle 2 low and candle 2 low must be greater than candle 3 low. Thus making sure that candle 2 is within the range of candle's 1 and 3 and doesn't have a high or low that is either above or below candle 1 and 3. 'and' is the operator to make sure that all of these values must be true in order for that candle to meet the criteria of getting colored.
// Apply bar color to Sandwiched candle if candle is found.
barcolor(isCustomPattern() ? userColor : na, offset=-1) //this targets the findings from isCustomPattern() and uses the user color chosen in settings and colors the middle bar by using offset=-1, otherwise it would color candle 3, so offset goes back 1 candle to color the middle candle.
If this script is already in circulation, please let me know and i'll remove it immediately. I checked but couldn't find one that did it.
Script open-source
In pieno spirito TradingView, il creatore di questo script lo ha reso open-source, in modo che i trader possano esaminarlo e verificarne la funzionalità. Complimenti all'autore! Sebbene sia possibile utilizzarlo gratuitamente, ricorda che la ripubblicazione del codice è soggetta al nostro Regolamento.
Declinazione di responsabilità
Le informazioni ed i contenuti pubblicati non costituiscono in alcun modo una sollecitazione ad investire o ad operare nei mercati finanziari. Non sono inoltre fornite o supportate da TradingView. Maggiori dettagli nelle Condizioni d'uso.