PROTECTED SOURCE SCRIPT
Realistic Trader Volume, Consolidation, Zones v.2
Realistic Trader Volume, Consolidation, Zones v.2
This volume-focused indicator gives you a clean, high-resolution view of market momentum and consolidation, without relying on a traditional volume panel.
A more intuitive volume tool that highlights relative volume conditions directly on candles
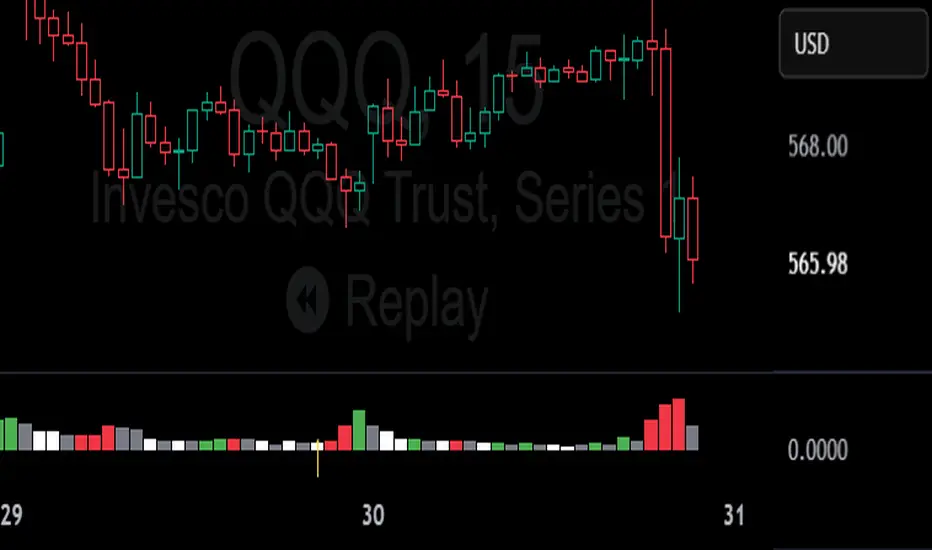
Surge bars color-coded based on context:
→ Green = Bullish Volume
→ Red = Bearish Volume
→ Gray = Continuation / Decline
Consolidation zones shown with white candles, identifying both currently forming and historical bases
Yellow arrows indicate consolidation breaks with volume surges, suggesting key shifts in momentum
Can help confirm when the market is likely to accelerate during a session
Useful for spotting early signs of reversals: Green after selloffs = potential buyers stepping in; Red after rallies = potential sellers stepping in
Zones can be manually drawn around a yellow arrow and its preceding white candle for more visual clarity
The bigger the green or red surge bar following a yellow arrow, the more powerful the zone
Works across all timeframes
Best used in combination with:
Realistic Trader Prior Days Levels & Zones
Realistic Trader Intraday Dynamic Zones & Levels
Realistic Trader Early Price Breaks & Confirmation (15min Only)
Realistic Trader Directional Bias
Pro Tip:
Yellow arrows mark key moments when consolidation ends and volume spikes begin. The taller the breakout candle that follows the yellow arrow, the stronger and more reliable the resulting zone is likely to be.
This volume-focused indicator gives you a clean, high-resolution view of market momentum and consolidation, without relying on a traditional volume panel.
A more intuitive volume tool that highlights relative volume conditions directly on candles
Surge bars color-coded based on context:
→ Green = Bullish Volume
→ Red = Bearish Volume
→ Gray = Continuation / Decline
Consolidation zones shown with white candles, identifying both currently forming and historical bases
Yellow arrows indicate consolidation breaks with volume surges, suggesting key shifts in momentum
Can help confirm when the market is likely to accelerate during a session
Useful for spotting early signs of reversals: Green after selloffs = potential buyers stepping in; Red after rallies = potential sellers stepping in
Zones can be manually drawn around a yellow arrow and its preceding white candle for more visual clarity
The bigger the green or red surge bar following a yellow arrow, the more powerful the zone
Works across all timeframes
Best used in combination with:
Realistic Trader Prior Days Levels & Zones
Realistic Trader Intraday Dynamic Zones & Levels
Realistic Trader Early Price Breaks & Confirmation (15min Only)
Realistic Trader Directional Bias
Pro Tip:
Yellow arrows mark key moments when consolidation ends and volume spikes begin. The taller the breakout candle that follows the yellow arrow, the stronger and more reliable the resulting zone is likely to be.
Script protetto
Questo script è pubblicato come codice protetto. Tuttavia, è possibile utilizzarle liberamente e senza alcuna limitazione – ulteriori informazioni qui.
Declinazione di responsabilità
Le informazioni e le pubblicazioni non sono intese come, e non costituiscono, consulenza o raccomandazioni finanziarie, di investimento, di trading o di altro tipo fornite o approvate da TradingView. Per ulteriori informazioni, consultare i Termini di utilizzo.